Trade
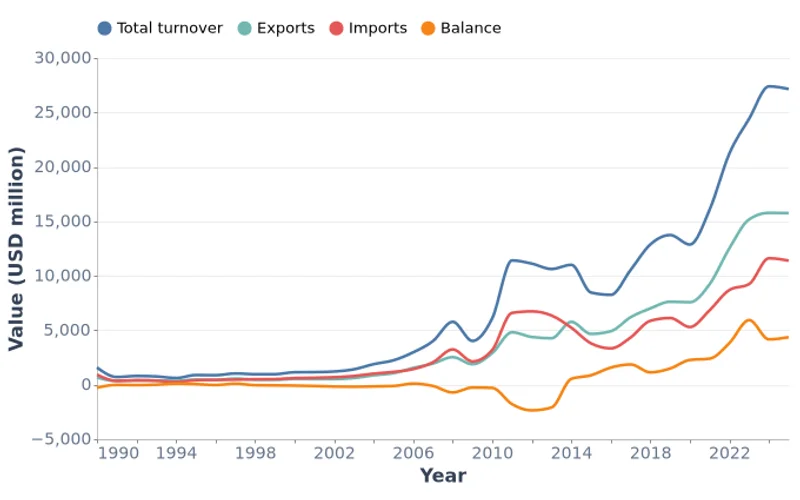
Mongolia Foreign Trade, Million USD (1924–2025)
Annual foreign trade statistics for Mongolia from 1924 to 2025, covering total turnover, exports, imports, and trade balance in million USD. Data sourced from the National Statistics Office.
Annual foreign trade statistics for Mongolia from 1924 to 2025, covering total turnover, exports, imports, and trade balance in million USD. Data sourced from the National Statistics Office.
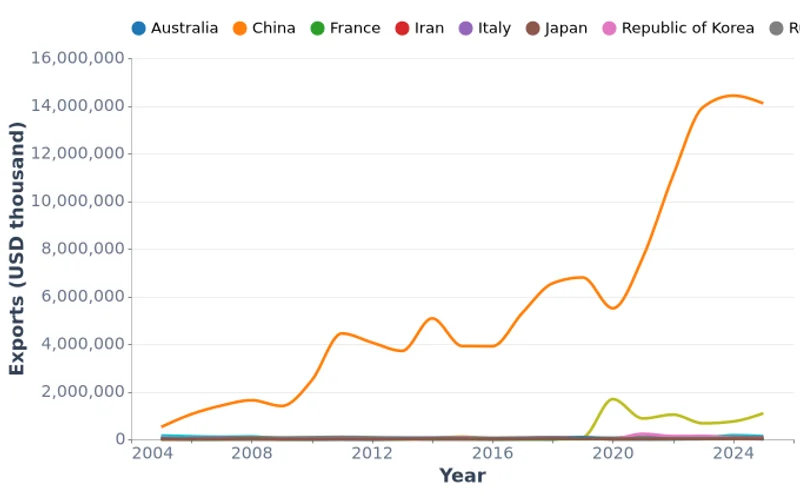
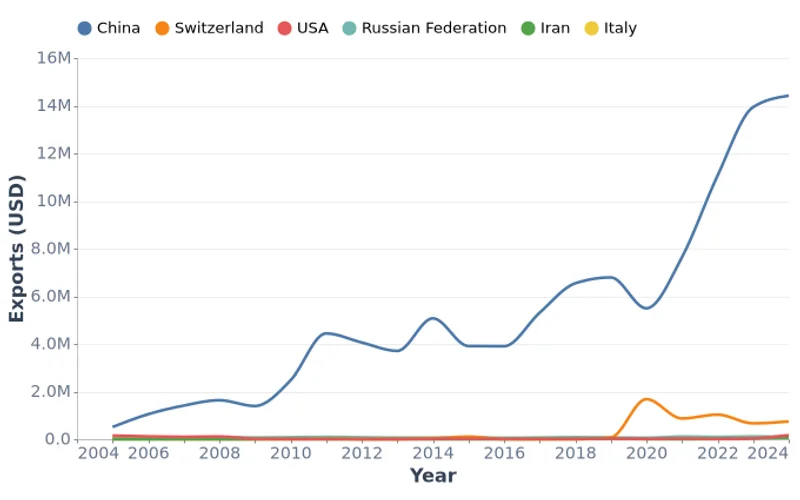
Annual exports from Mongolia to the top 10 trading partner countries from 2005 to 2025, in USD thousands. China dominates with over 90% share. Full dataset includes all partner countries.
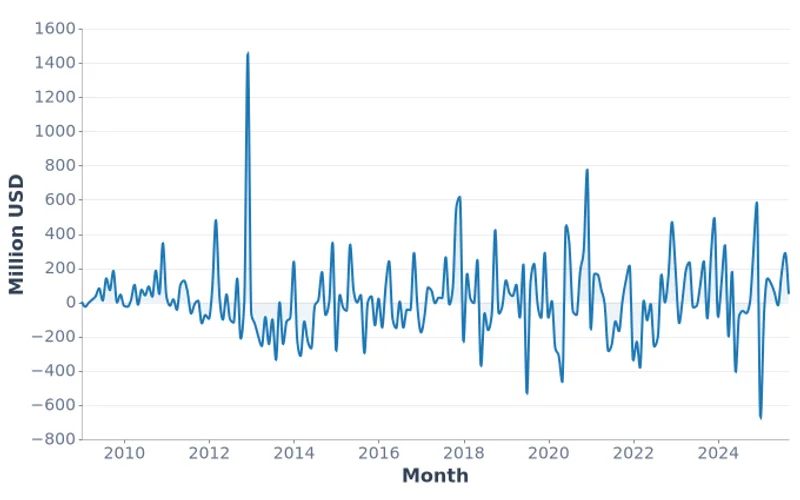
Monthly foreign trade data for Mongolia from January 1997 to April 2026, covering total turnover, exports, imports, and trade balance in million USD, sourced from the National Statistics Office.
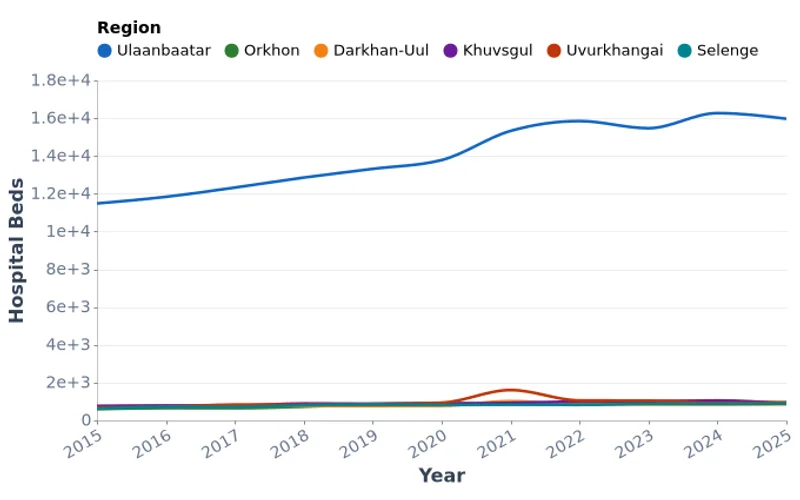
Hospital bed counts across Mongolia's major provinces from 2015 to 2025. Ulaanbaatar accounts for the majority of national capacity, while provincial capitals like Orkhon, Darkhan-Uul, Uvurkhangai, and Khuvsgul maintain regional health infrastructure.
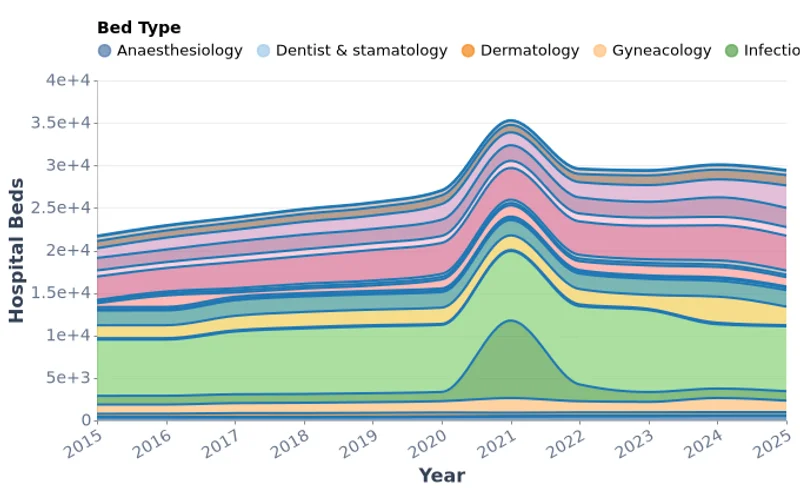
Total hospital beds across 21 clinical specialties in Mongolia from 2015 to 2025. Internal medicine dominates with over 7,600 beds, followed by pediatrics and traditional medicine. Total bed capacity has grown steadily as Mongolia expands tertiary care.
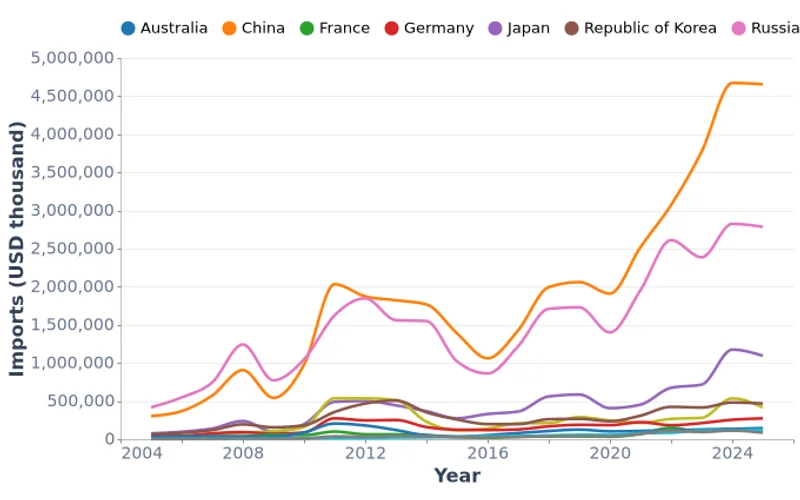
Annual imports to Mongolia from the top 10 trading partner countries from 2005 to 2025, in USD thousands. China and Russia are the two dominant suppliers. Full dataset covers all partner countries.
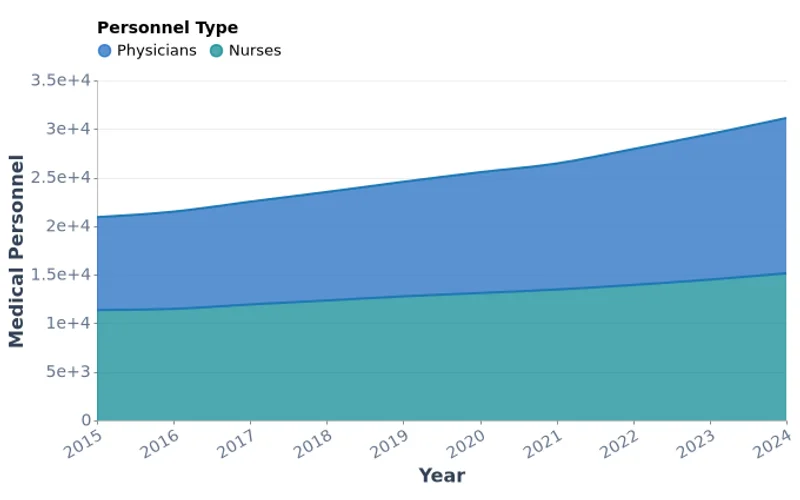
National totals of physicians and nurses in Mongolia from 2015 to 2024. Both workforces have grown substantially — physicians increased 67% to nearly 16,000 and nurses grew 33% to over 15,000 — reflecting Mongolia's continued investment in health system capacity.
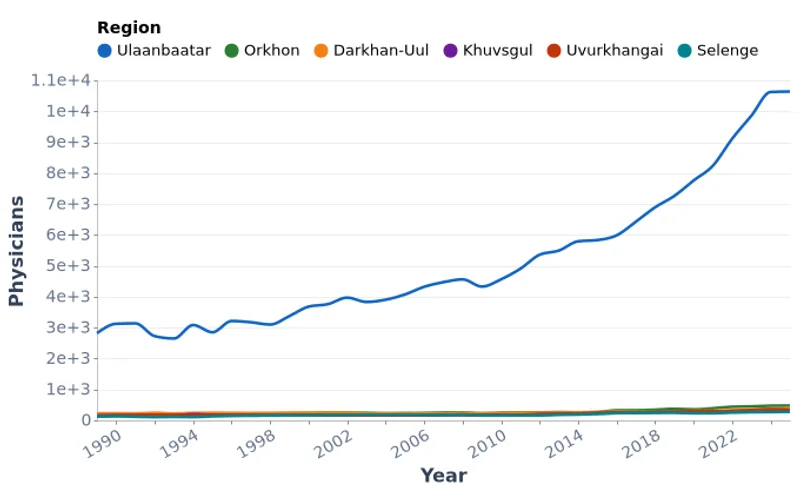
Number of physicians across Mongolia's major provinces from 1989 to 2025. The physician workforce has more than tripled over 35 years, with Ulaanbaatar hosting over 10,600 doctors in 2025. Regional provinces have seen steady but slower growth.
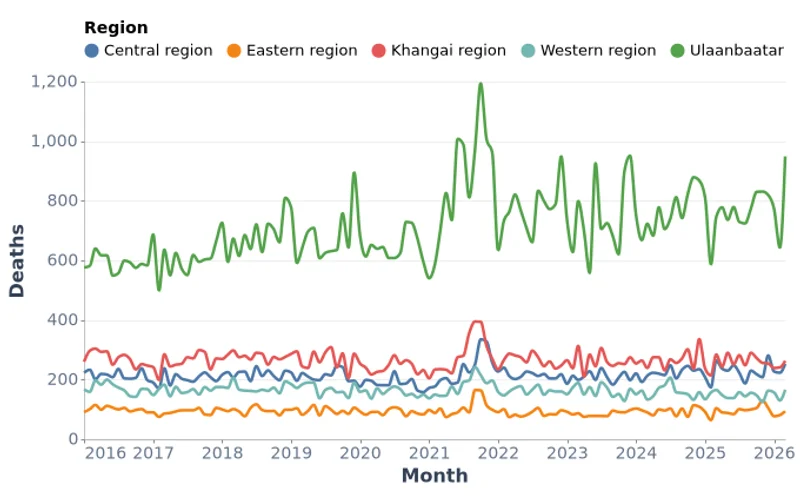
Monthly death counts across Mongolia's four regions and Ulaanbaatar from January 2016 to March 2026, sourced from the National Statistics Office.
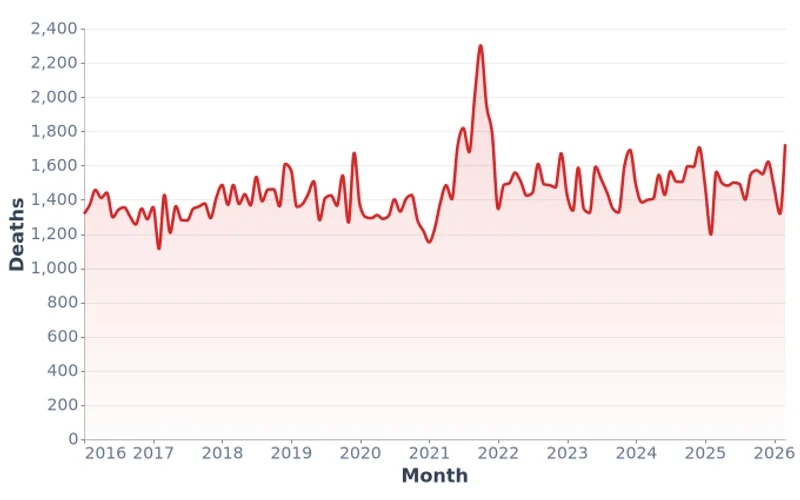
Monthly death counts for Mongolia from January 2016 to March 2026, including winter mortality spikes, sourced from the National Statistics Office.
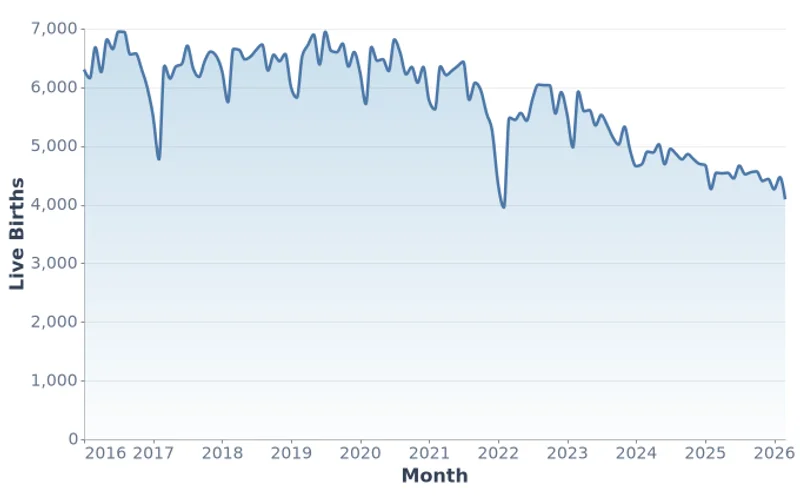
Monthly live birth counts for Mongolia from January 2016 to March 2026, sourced from the National Statistics Office.
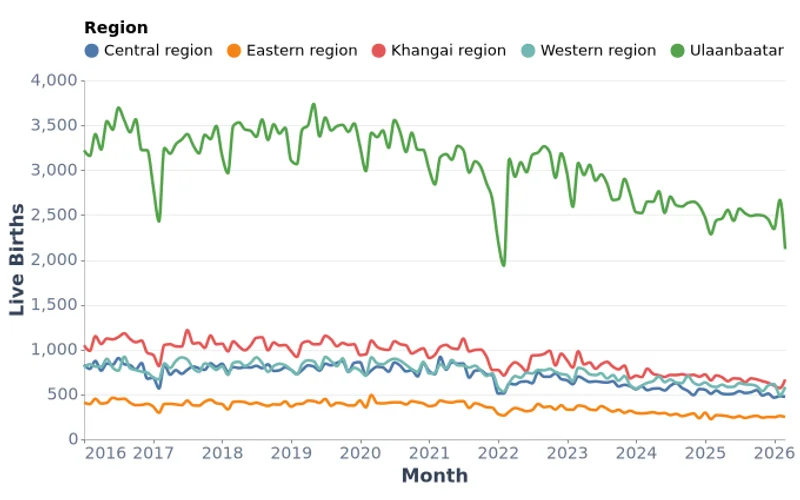
Monthly live births across Mongolia's four regions and Ulaanbaatar from January 2016 to March 2026, sourced from the National Statistics Office.
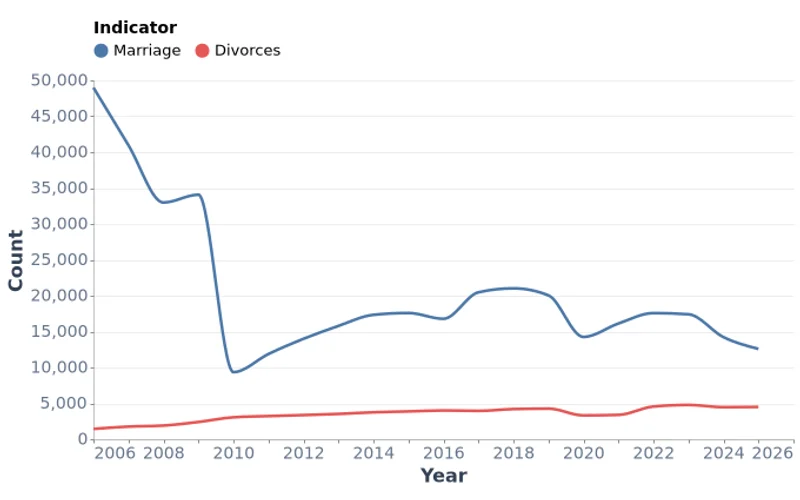
Annual counts of marriages and divorces in Mongolia from 2006 to 2025, showing long-term trends in family formation, sourced from the National Statistics Office.
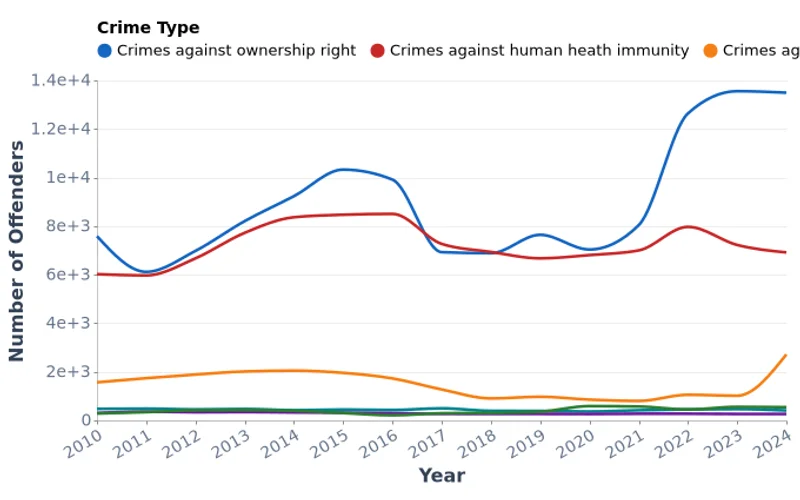
Number of criminal offenders in Mongolia by crime category from 2010 to 2024. Property crime offenders consistently dominate, reflecting the structure of recorded crime.
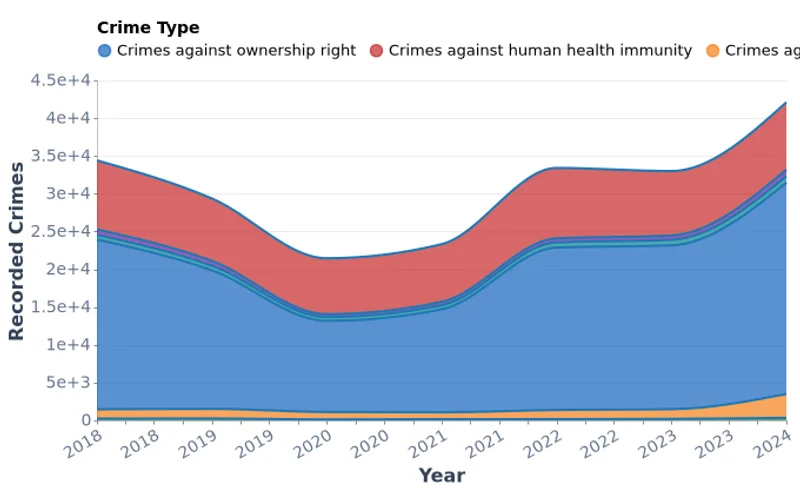
Annual recorded crimes in Mongolia broken down by major crime category from 2018 to 2024. Property crimes dominate, accounting for over 60% of all recorded offences.
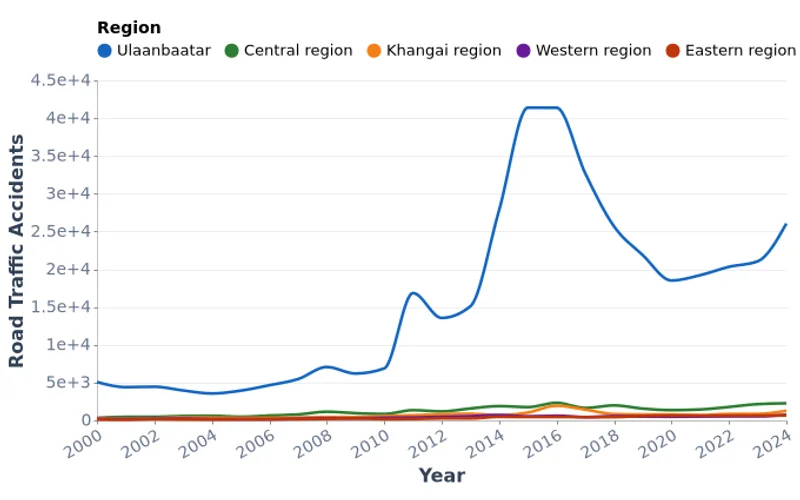
Annual road traffic accidents in Mongolia by macro-region from 2000 to 2024. Ulaanbaatar accounts for over 80% of all accidents, with a sharp rise after 2020 reversing an earlier downward trend.
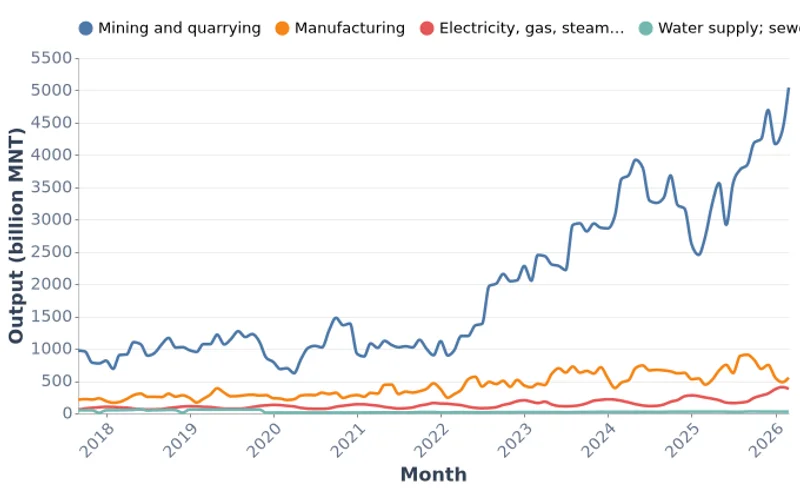
Monthly gross industrial output broken down by major subdivision (mining, manufacturing, utilities) in billion MNT from September 2017 to March 2026, sourced from the National Statistics Office.
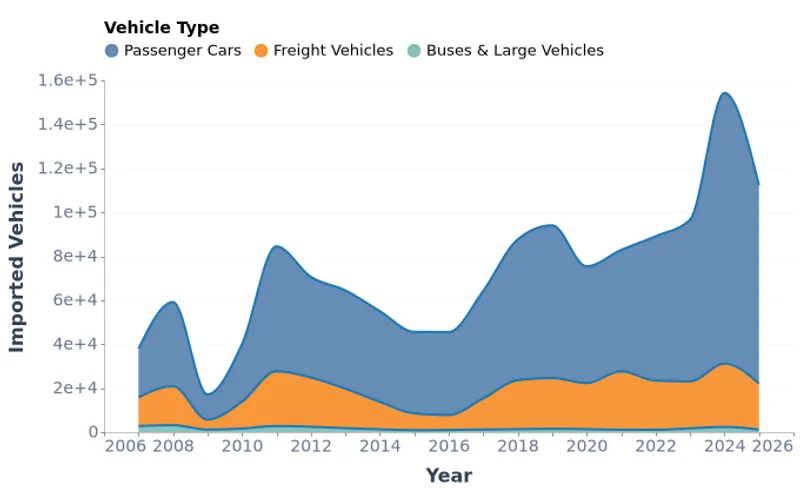
Passenger cars make up over 80% of Mongolia's vehicle imports, with 2024 recording 154,294 total vehicles imported — a 4-fold increase since 2007.
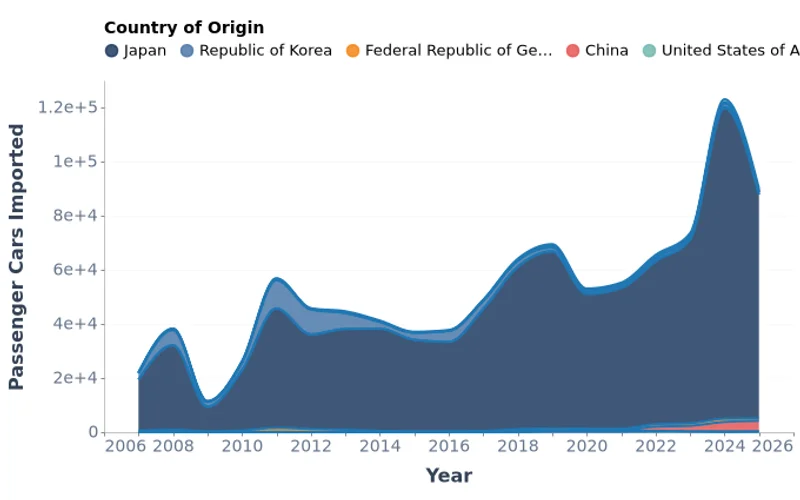
Japan supplied 93.3% of Mongolia's 123,023 imported passenger cars in 2024, followed by China (3,546) and Republic of Korea (1,365), reflecting Mongolia's strong dependence on used vehicle imports from East Asia.
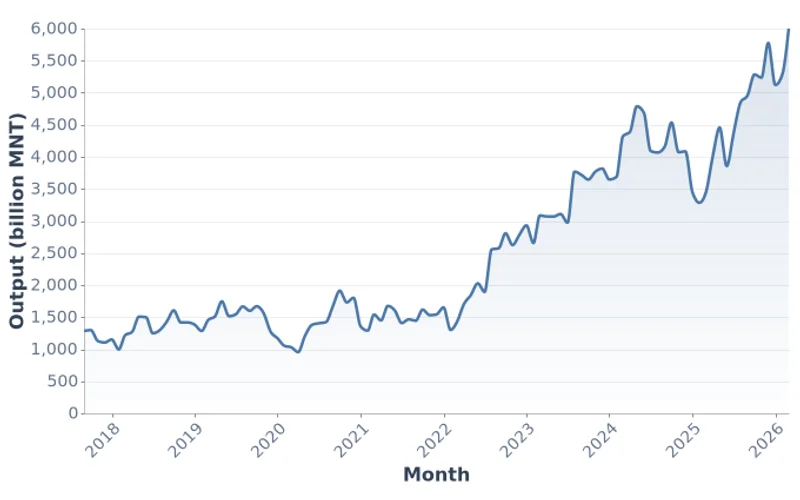
Monthly gross industrial output for Mongolia from September 2017 to March 2026, measured in billion MNT, sourced from the National Statistics Office.
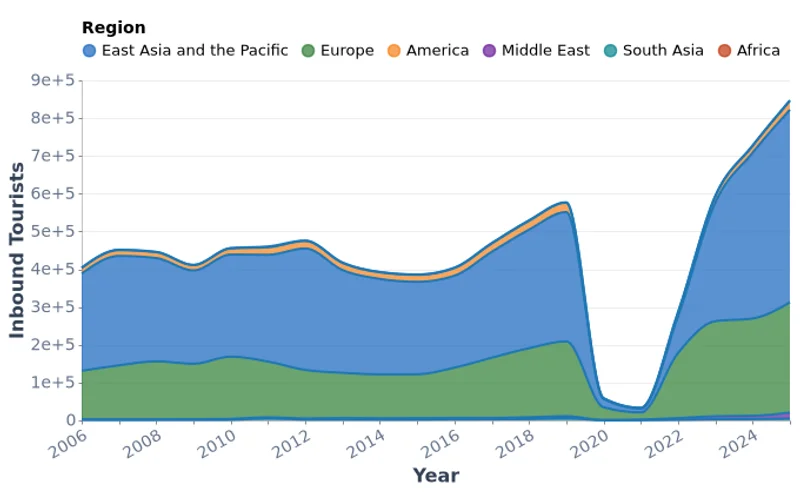
Annual inbound tourists to Mongolia broken down by geographical region (East Asia and the Pacific, Europe, America, Middle East, South Asia, Africa) from 2006 to 2025.
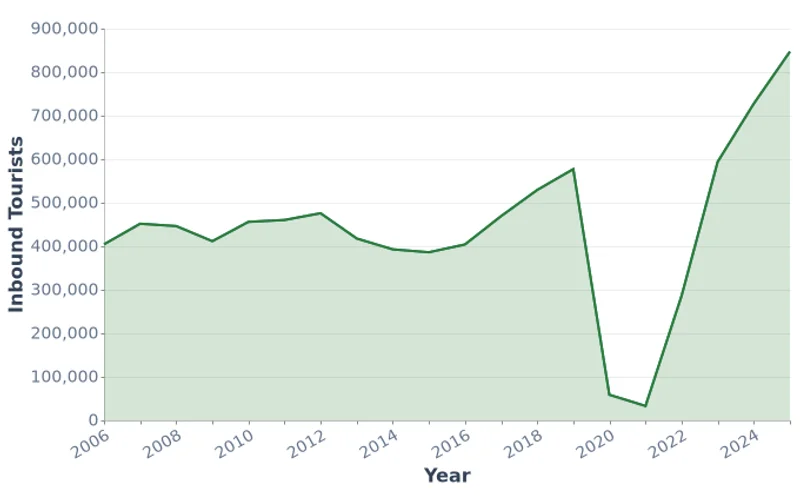
Annual number of inbound foreign tourists arriving in Mongolia from 2006 to 2025, showing the COVID-19 impact and post-pandemic recovery.
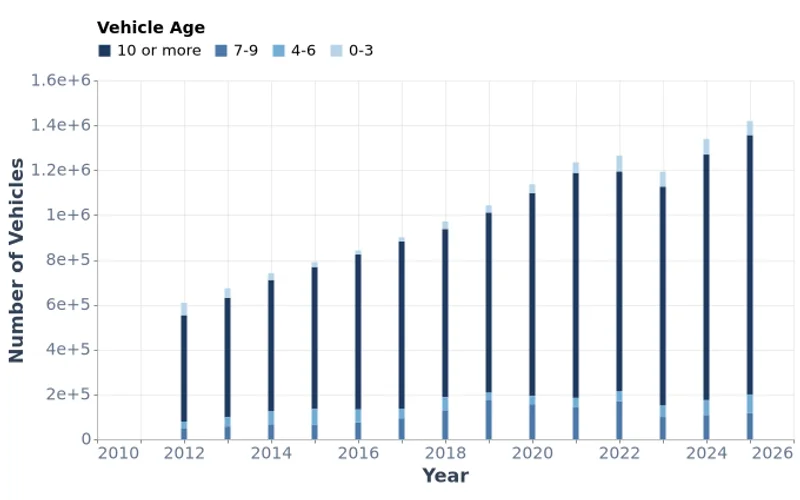
Annual breakdown of registered vehicles in Mongolia by age group from 2012 to 2025. Over 80% of Mongolia's fleet is more than 10 years old, reflecting the country's heavy reliance on used vehicle imports.
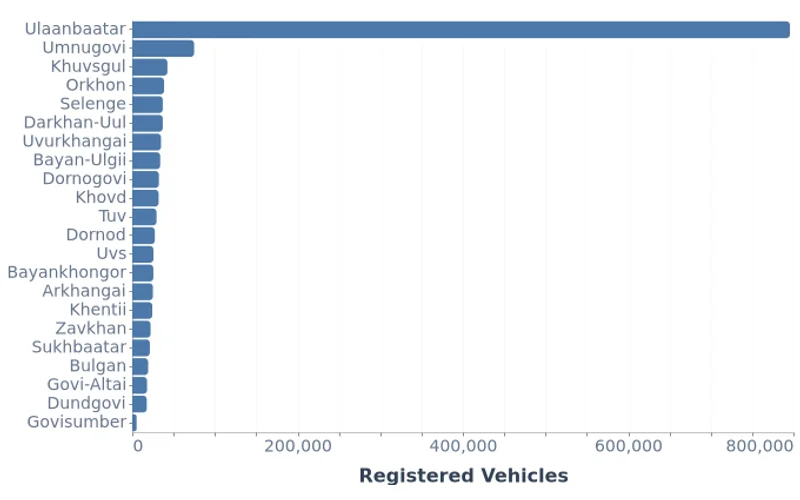
Ulaanbaatar accounts for nearly 60% of all registered vehicles in Mongolia, with Umnugovi ranking second among the 21 provinces. Annual data from 2012 to 2025 covering all aimags and the capital.
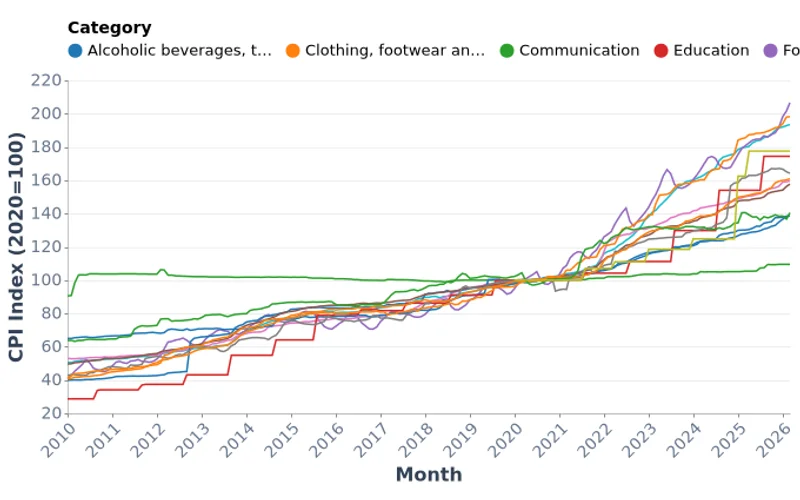
Monthly Consumer Price Index (2020=100) for Mongolia broken down by 13 spending categories including food, housing, transport, and energy, from 2010 to March 2026.
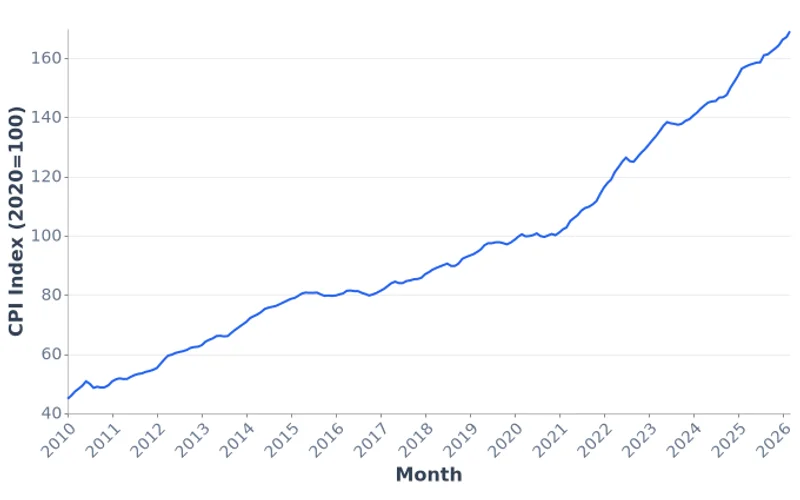
Headline national Consumer Price Index (2020=100) for Mongolia from January 2010 to March 2026, sourced from the National Statistics Office.
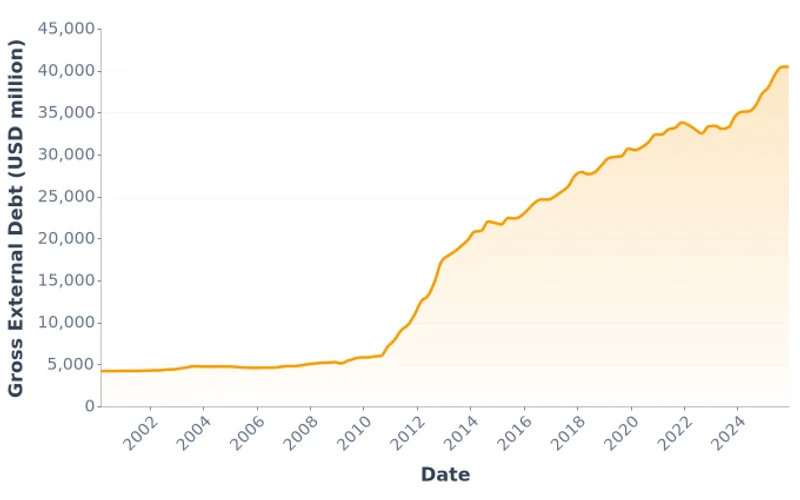
Quarterly gross external debt position of Mongolia from Q1 2000 to Q4 2025. External debt grew from 4.2 billion USD in 2000 to over 40 billion USD by end of 2025, reflecting increased sovereign and private borrowing.

Outstanding individual/consumer loans in Mongolia from March 2000 to February 2026. Individual lending grew from 4 billion MNT in 2000 to over 26 trillion MNT by 2026, reflecting rapid growth in household credit.
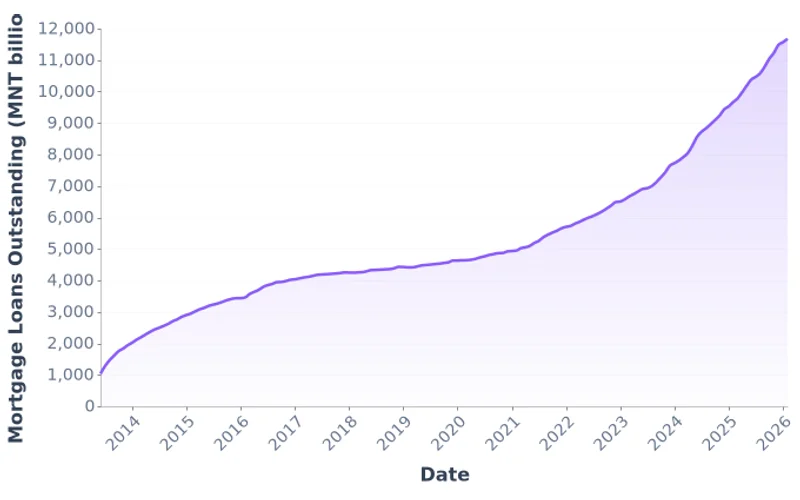
Monthly outstanding mortgage loans in Mongolia from June 2013 to February 2026. Mortgage lending grew from 1 trillion MNT in 2013 to nearly 12 trillion MNT by 2026, driven by government housing programs.
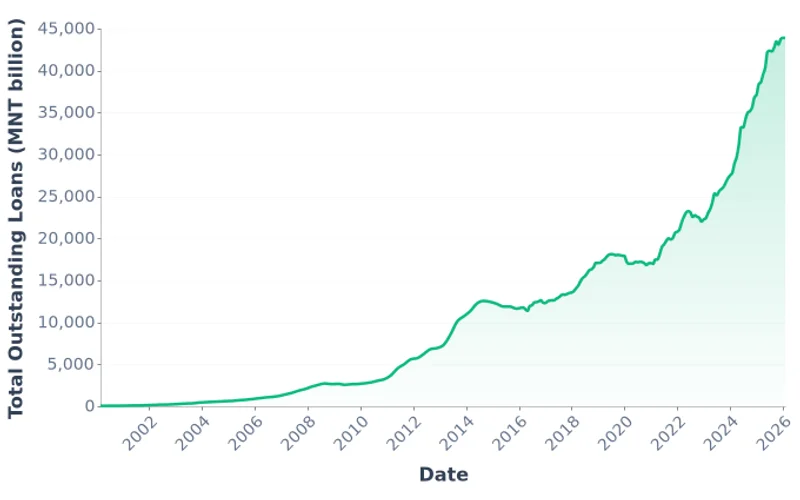
Total outstanding bank loans in Mongolia from March 2000 to February 2026. Bank lending grew from 50 billion MNT in 2000 to nearly 44 trillion MNT by 2026, reflecting rapid credit expansion in the economy.
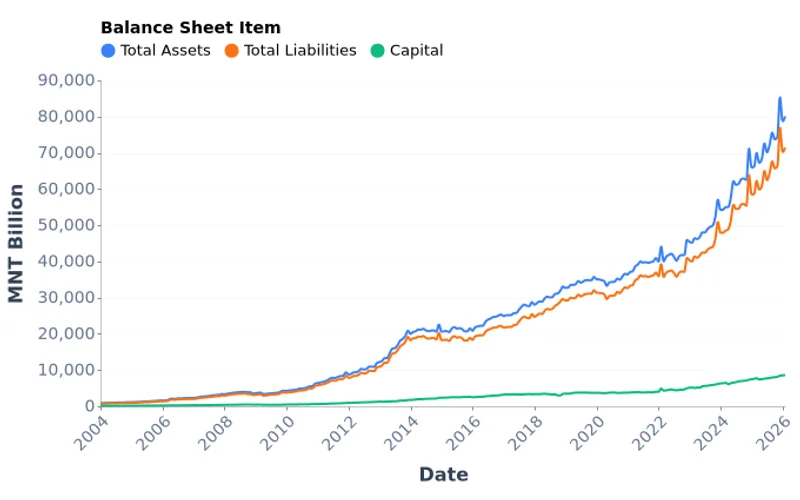
Monthly consolidated balance sheet of Mongolia's active banking sector from January 2004 to February 2026, showing total assets, total liabilities, and capital. Total banking sector assets grew from 1,185 billion MNT in 2004 to over 80,000 billion MNT by February 2026.
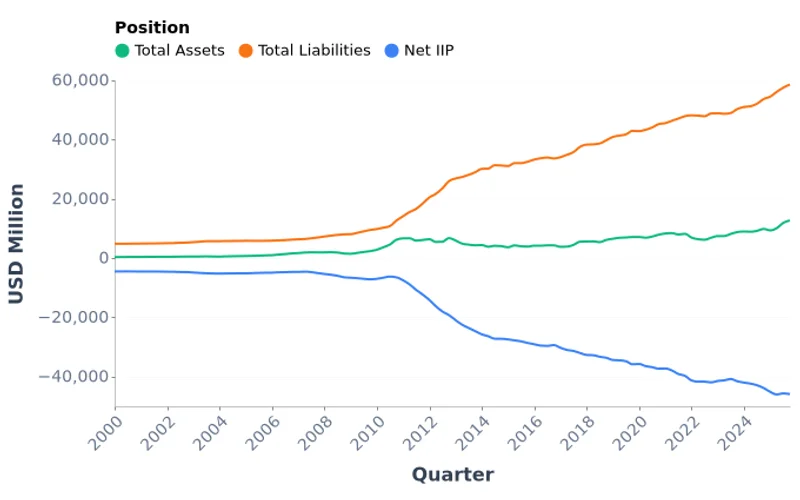
Quarterly international investment position (IIP) of Mongolia from Q1 2000 to Q3 2025, showing total external assets, total liabilities, and net IIP in million USD. Mongolia's net IIP stood at -45,905 million USD in Q3 2025, reflecting significant foreign liabilities relative to external assets.
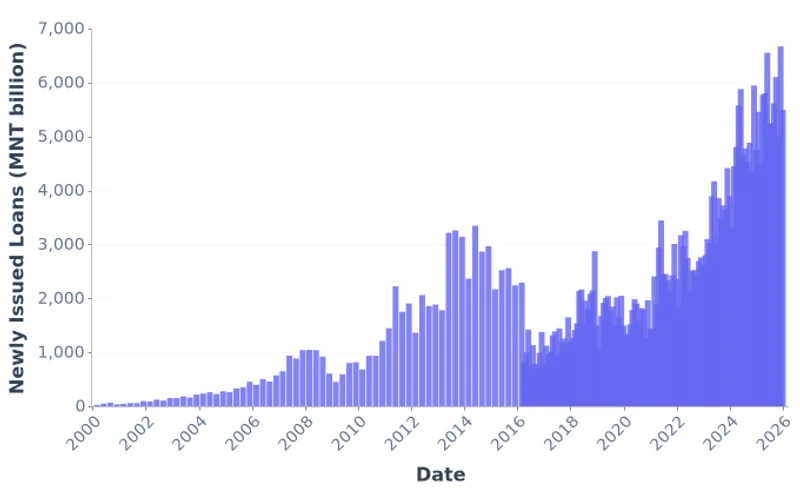
Monthly flow of newly issued bank loans in Mongolia from March 2000 to January 2026. This is a flow variable showing the volume of new credit created each month, growing from 25 billion MNT in 2000 to over 5,497 billion MNT per month by January 2026.
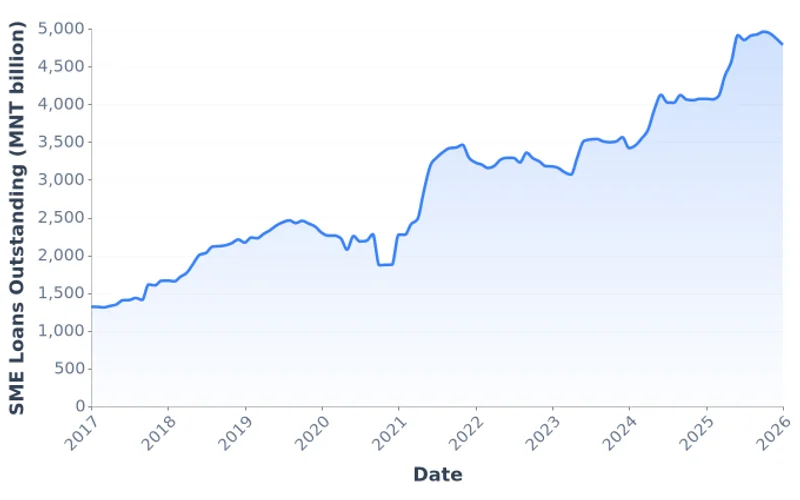
Monthly outstanding loans to small and medium enterprises (SMEs) from Mongolia's banking sector, from January 2017 to January 2026. SME loans grew from 1,317 billion MNT in early 2017 to 4,786 billion MNT by January 2026, reflecting strong policy support for small business credit.
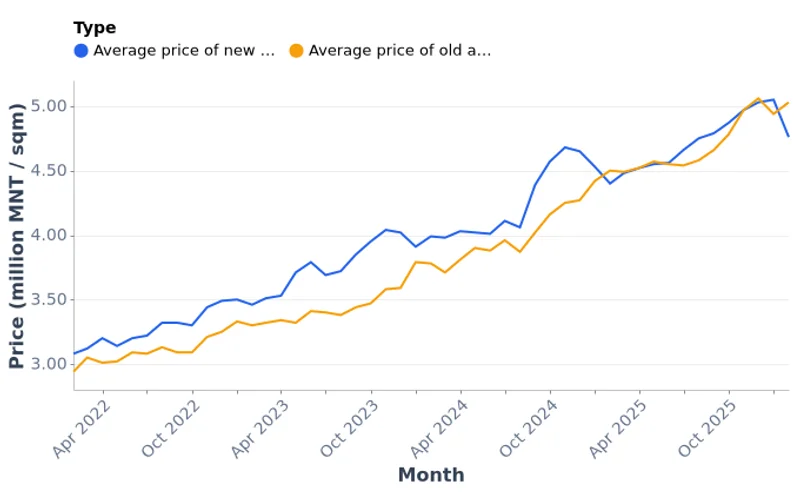
Monthly average apartment price per square meter in Ulaanbaatar's 6 central districts. New apartments reached 5.05 million MNT/sqm in late 2025.
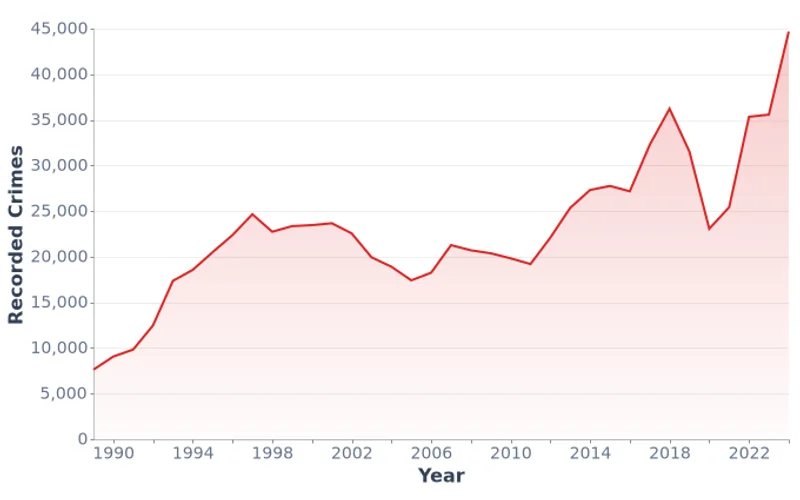
Annual number of recorded crimes in Mongolia from 1989 to 2024. Crimes peaked at 44,673 in 2024, the highest on record.
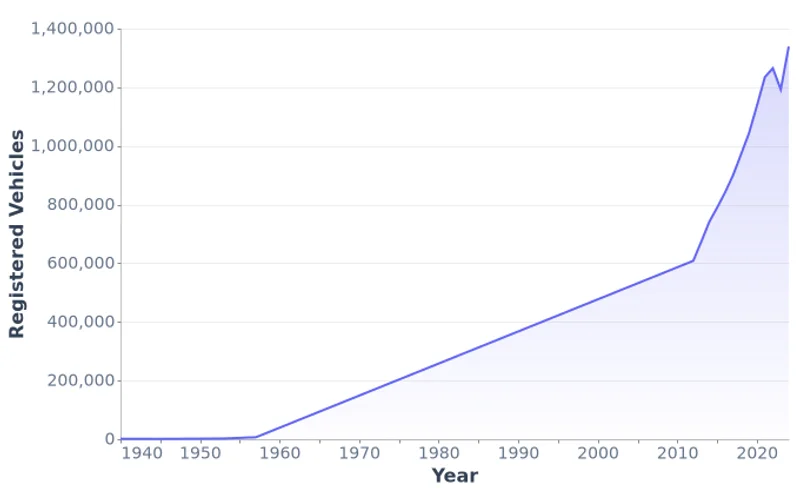
Annual number of registered vehicles in Mongolia from 1940 to 2024, aggregated national total.
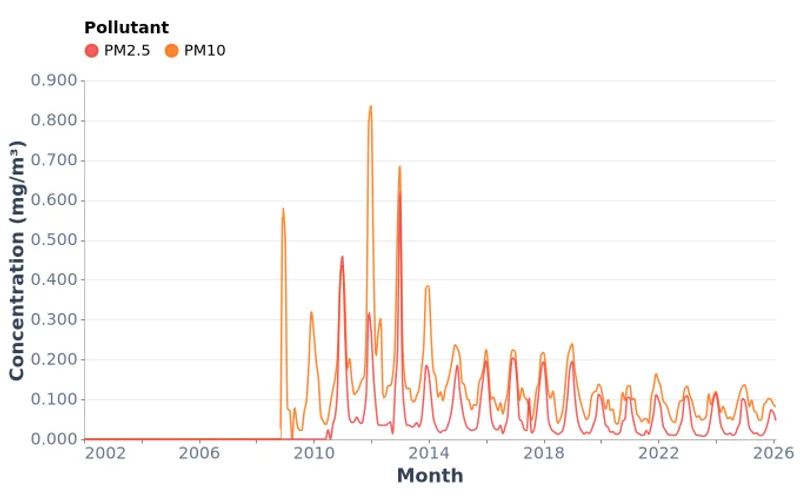
Monthly average PM2.5 and PM10 particulate matter concentrations in Ulaanbaatar from 2002 to 2026, averaged across city monitoring stations. PM2.5 peaked at 0.622 mg/m³ in winter months — over 40 times the WHO annual guideline of 0.015 mg/m³, highlighting the severity of UB's winter air pollution crisis.
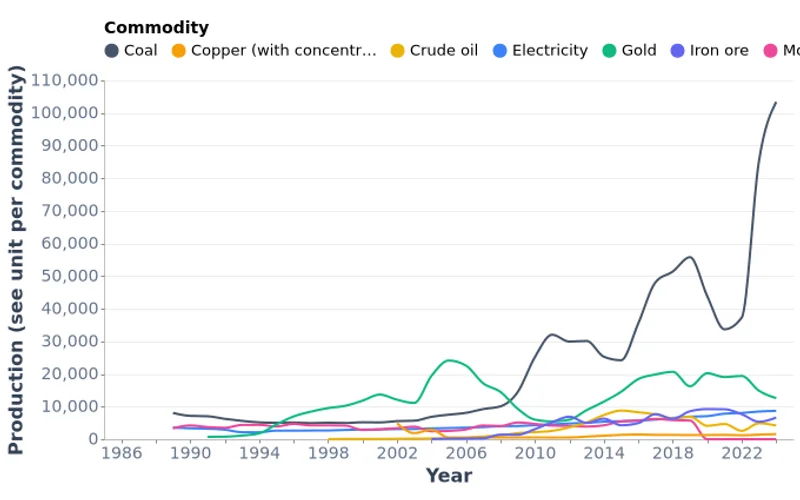
Annual production of key industrial commodities in Mongolia from 1989 to 2024, including coal, copper concentrate, gold, electricity, crude oil, iron ore, and molybdenum. Coal peaked at 51.5 million tonnes in 2022 while copper concentrate reached 1.8 million tonnes in 2023.
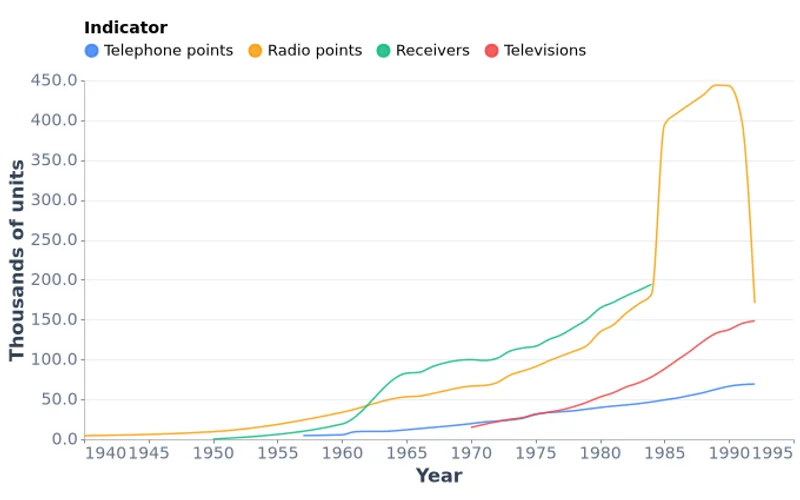
Historical data on Mongolia's telecommunications infrastructure from 1940 to 1992, covering 12 indicators including post offices, telephone points, radio points, and televisions. The data captures the growth of communications infrastructure during the socialist era.
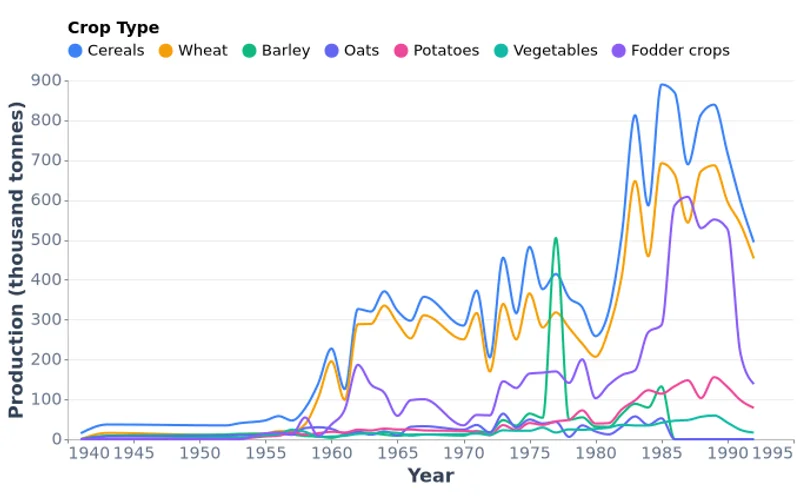
National gross crop production in Mongolia by type from 1941 to 1992, measured in thousand tonnes. Wheat dominated output, peaking at 782 thousand tonnes in 1990, while total cereals reached 839 thousand tonnes in 1989.
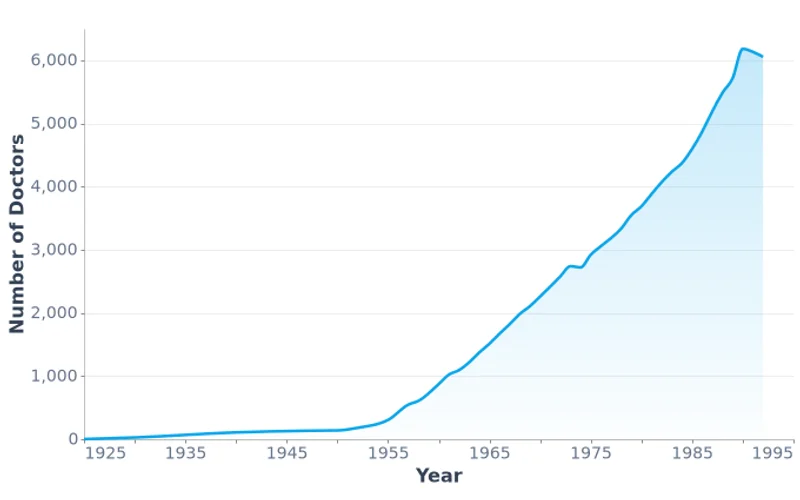
Total number of doctors in Mongolia from 1925 to 1992. Doctor numbers grew from just 2 in 1925 to over 6,000 by 1990, reflecting rapid expansion of the healthcare system over the Soviet era.
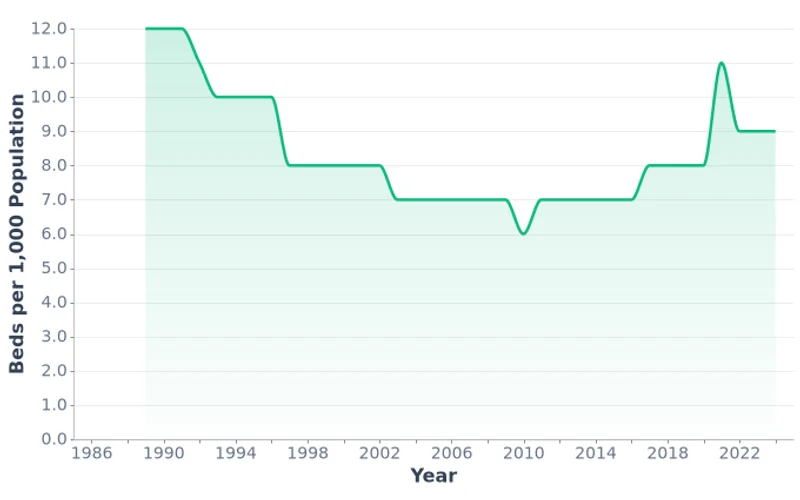
Hospital bed density in Mongolia measured as beds per 1,000 population from 1989 to 2024, covering 36 years of healthcare infrastructure data.
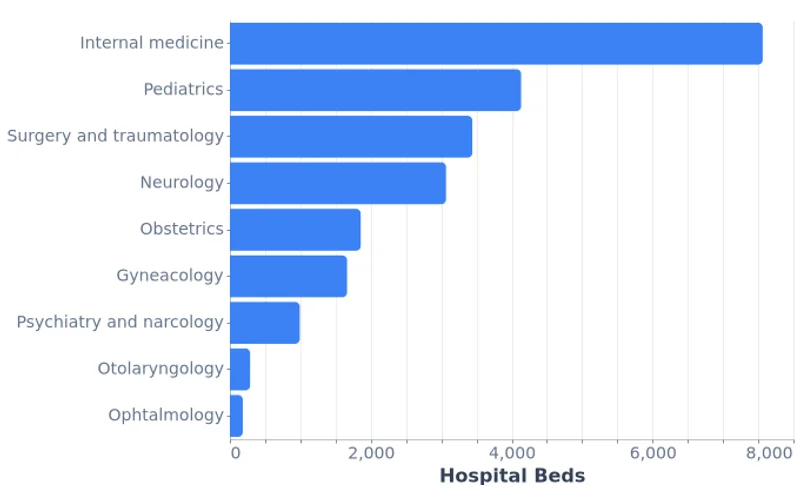
Number of hospital beds across 9 department types in Mongolia for 2024, from internal medicine to pediatrics.
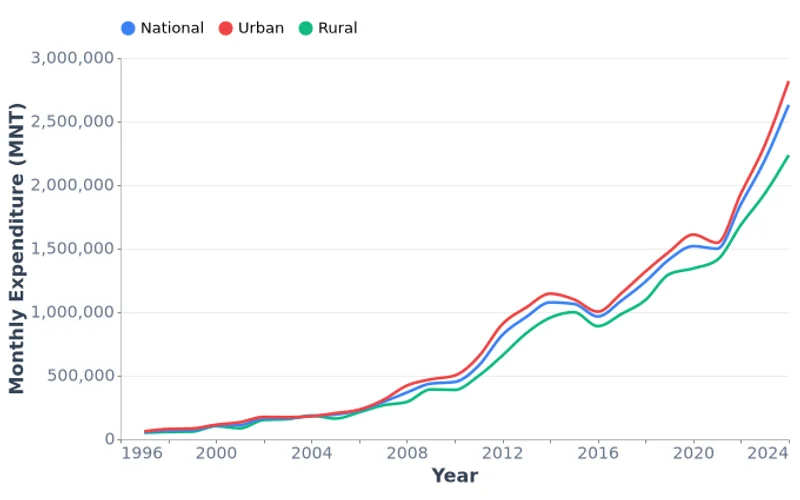
Average monthly household expenditure in Mongolian Tugrik (MNT) for National, Urban, and Rural populations from 1997 to 2024.
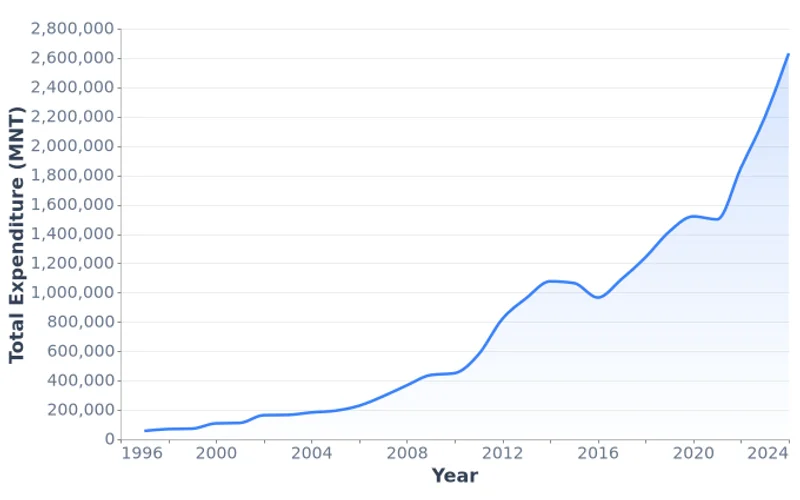
Annual average monthly household total expenditure in Mongolian tugrik (MNT) for Mongolia from 1997 to 2024.
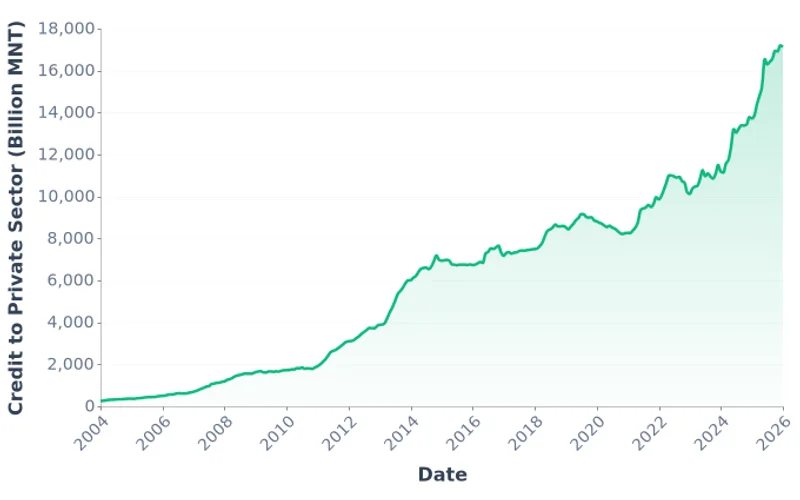
Monthly outstanding credit to the private sector from Mongolia's depository corporations, reaching 17.1 trillion MNT in January 2026.
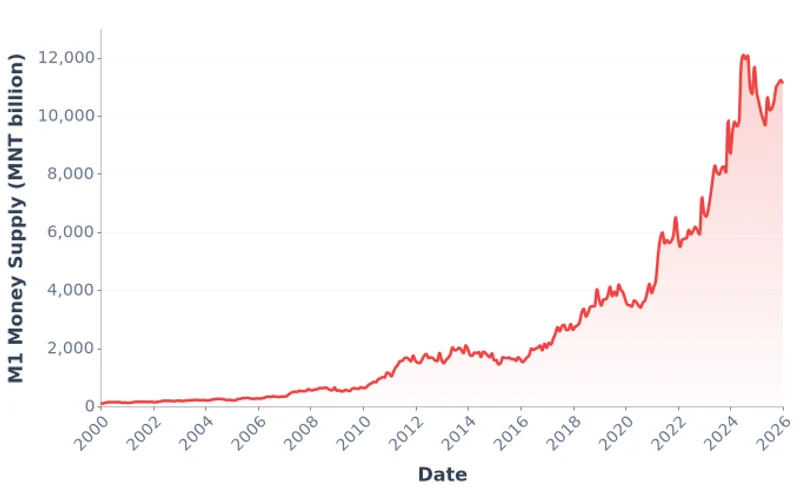
Monthly M1 money supply in Mongolia from January 2000 to January 2026. M1 comprises currency in circulation plus demand deposits and grew from 103 billion MNT in 2000 to over 11 trillion MNT by 2026.
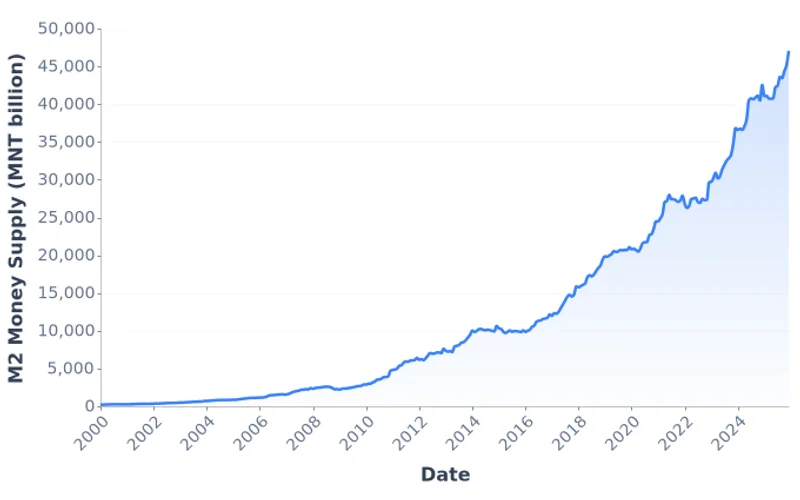
Monthly M2 money supply in Mongolia from March 1997 to February 2026. M2 comprises M1 plus time and savings deposits and grew from 115 billion MNT in 1997 to over 48 trillion MNT by 2026.
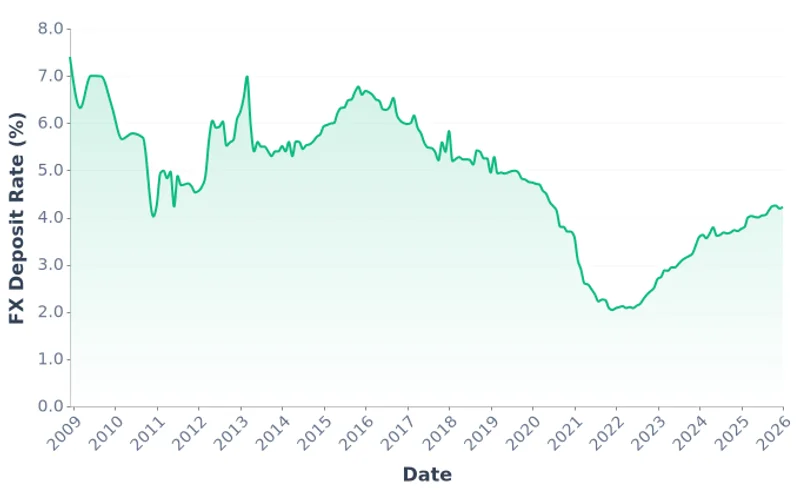
Monthly weighted average interest rate on outstanding foreign currency (FX) deposits in Mongolia, from December 2008 to January 2026. The FX deposit rate declined from 7.4% in 2008 to around 4% by 2025, reflecting global low interest rate cycles and shifting deposit incentives.
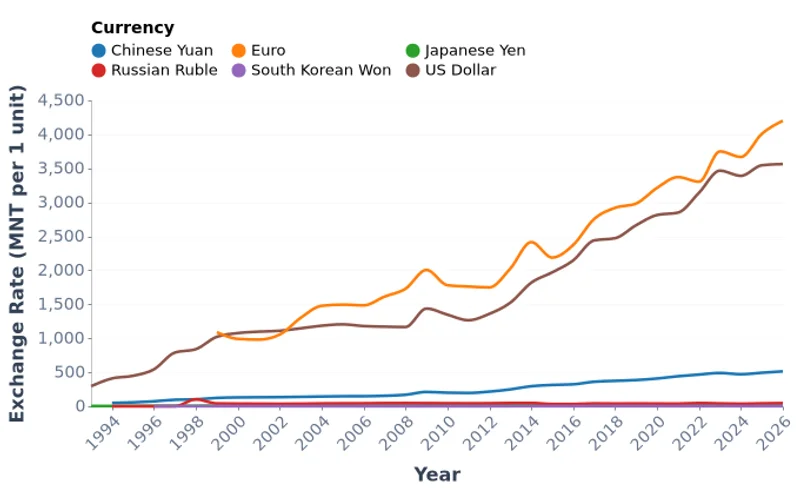
Annual average official exchange rates for six major currencies (USD, EUR, CNY, RUB, JPY, KRW) against the Mongolian Tugrik from 1993 to 2026. The USD has risen from 150 MNT in 1993 to over 3,500 MNT by 2025, reflecting Mongolia's economic transformation.
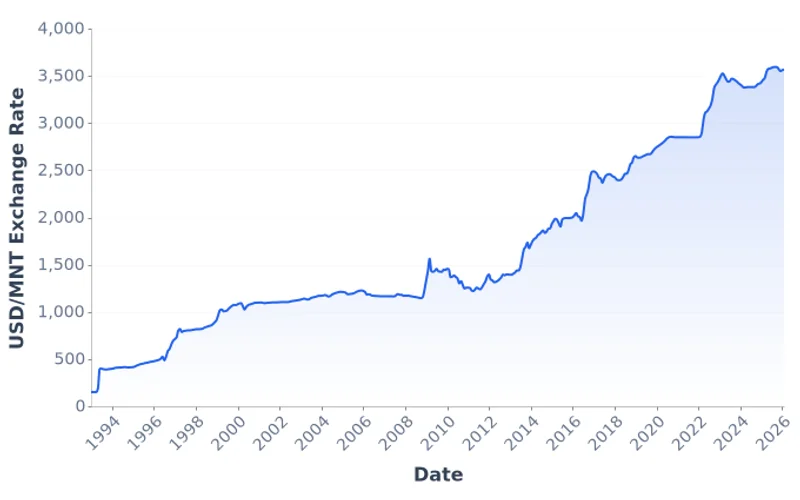
Monthly average official USD/MNT exchange rate from January 1993 to February 2026. The Mongolian Tugrik has depreciated from 150 MNT per USD in 1993 to over 3,500 MNT by 2025, driven by inflation, commodity cycles, and structural balance of payments pressures.
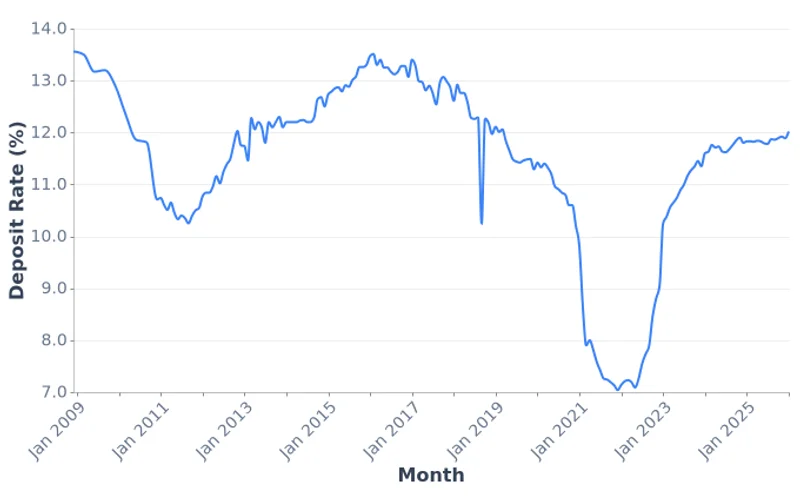
Monthly weighted average interest rate on MNT-denominated deposits in Mongolia, published by the Bank of Mongolia.
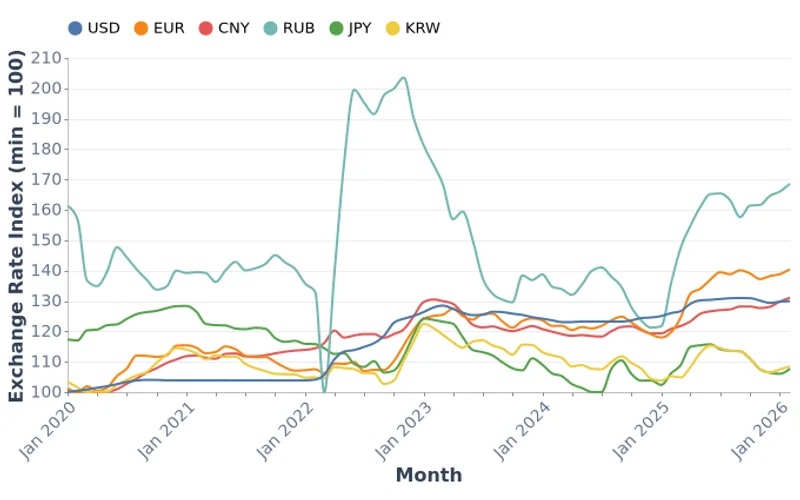
Monthly average exchange rates for USD, EUR, CNY, RUB, JPY, and KRW against the Mongolian Tugrik, derived from official daily closing rates published by the Bank of Mongolia.
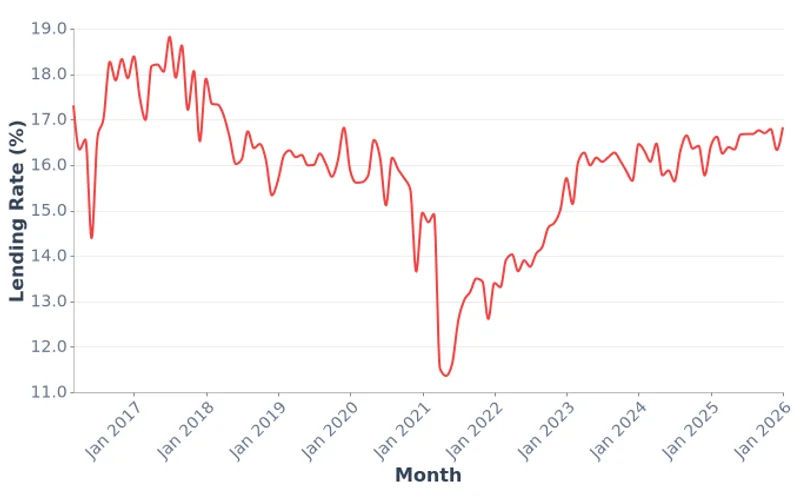
Monthly weighted average interest rate on MNT-denominated loans in Mongolia, published by the Bank of Mongolia.
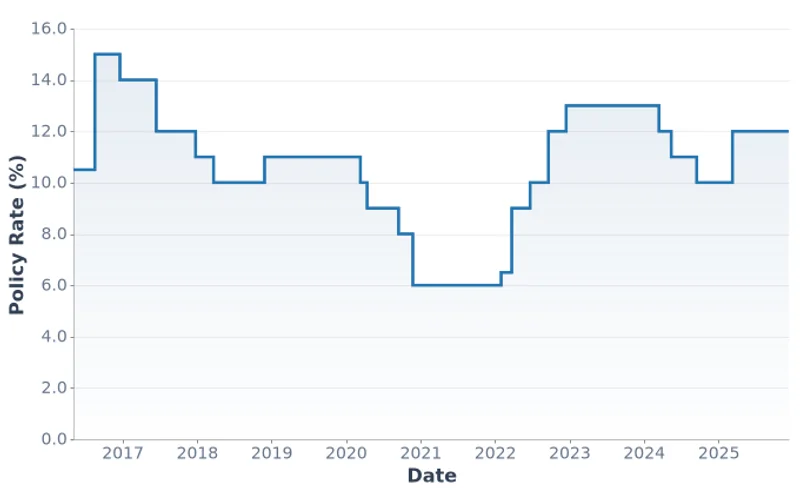
Mongolia's official monetary policy rate set by the Bank of Mongolia, showing rate decisions from May 2016 to December 2025. The rate peaked at 15.0% in August 2016 and stood at 12.0% as of December 2025.
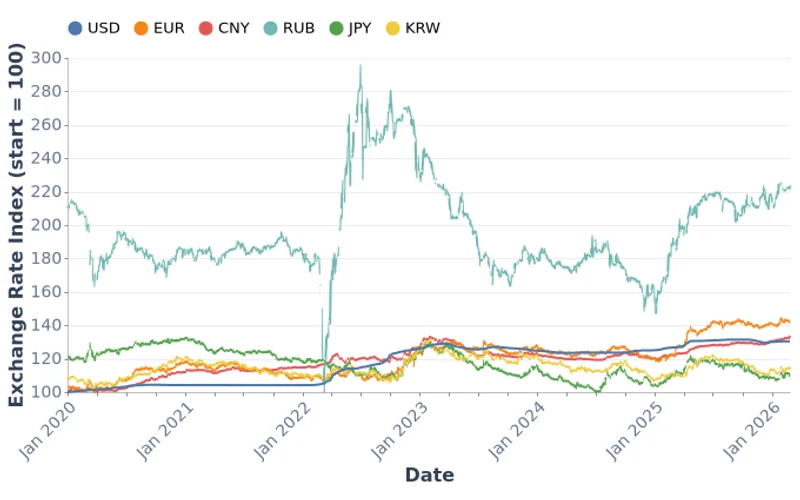
Official daily closing exchange rates for USD, EUR, CNY, RUB, JPY, and KRW against the Mongolian Tugrik, published by the Bank of Mongolia from 2020 to 2026.
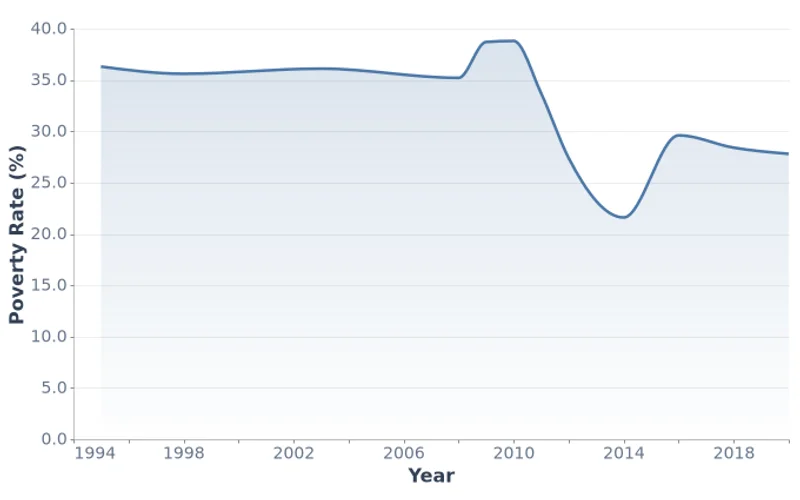
Mongolia's poverty rate peaked at 36.1% in 2003 and declined to 27.8% by 2020, with significant improvements following economic reforms.
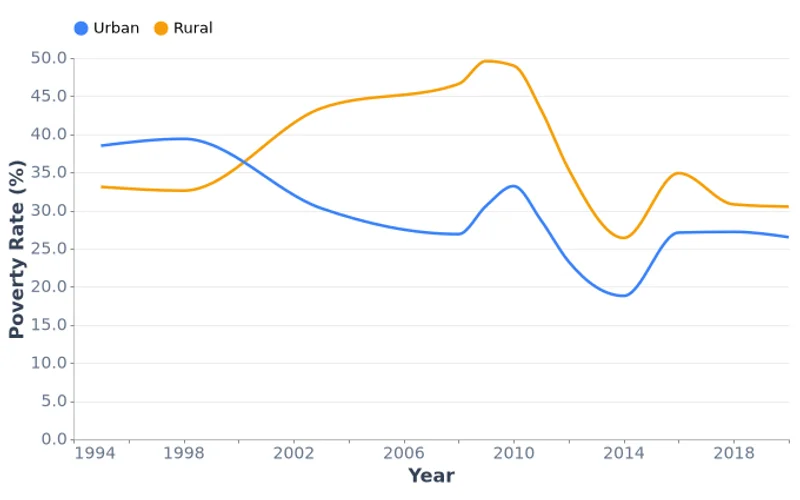
Poverty headcount rate comparing urban and rural populations in Mongolia from 1995 to 2020. Rural poverty exceeded urban poverty in 2020 at 30.5% versus 26.5%.
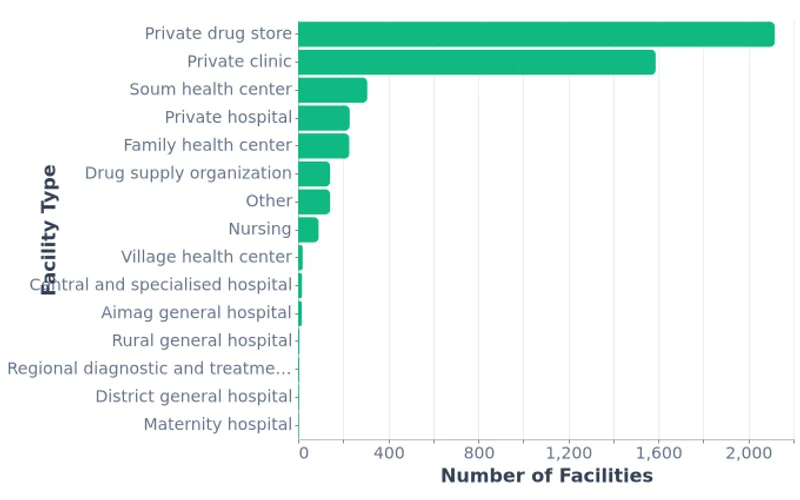
Mongolia had 4,914 registered health facilities in 2024, with private drug stores (2,117) and private clinics (1,588) accounting for the majority of all facilities nationwide.
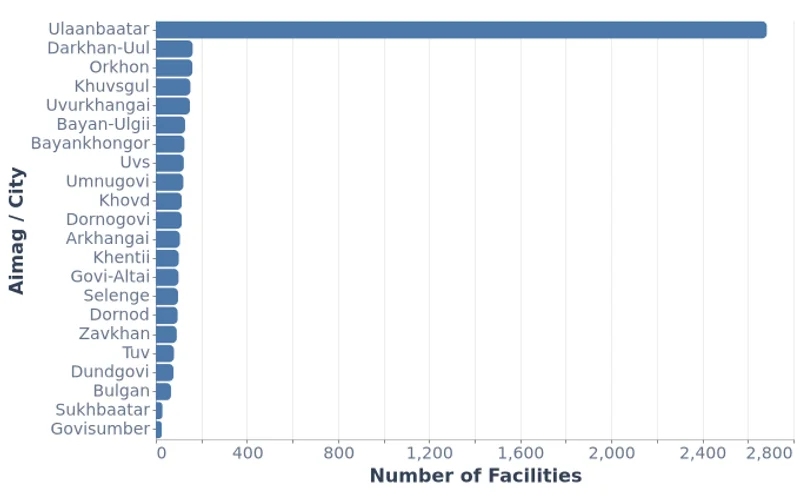
Mongolia's 22 aimags and the capital Ulaanbaatar together had 4,914 health facilities in 2024, with Ulaanbaatar accounting for the largest concentration.
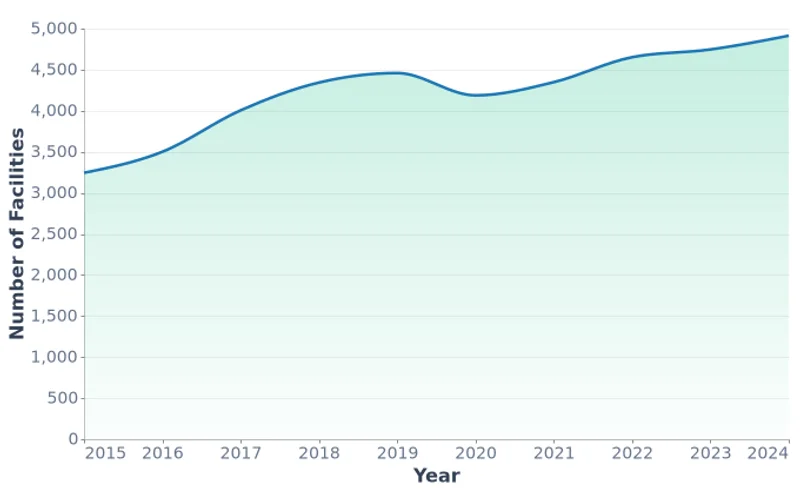
Mongolia had 4,914 registered health facilities in 2024, up from 3,244 in 2015, reflecting a 52% increase over the decade.
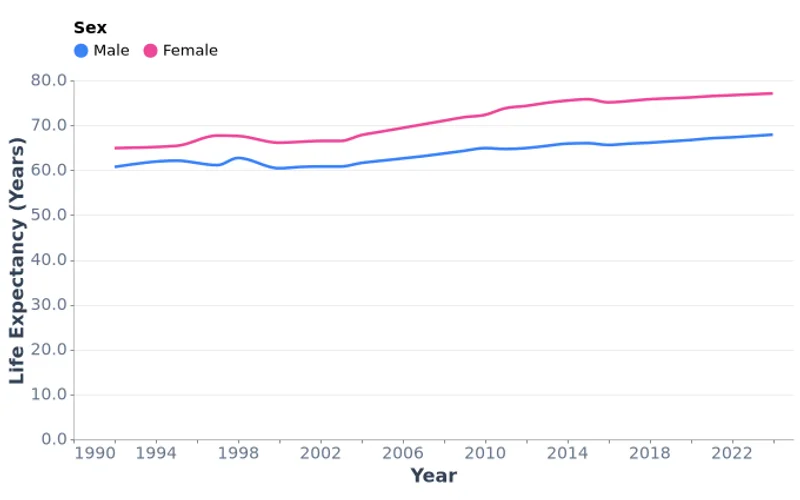
Mongolia's life expectancy at birth from 1992 to 2024, broken down by male and female, showing a persistent gender gap of approximately 9 years.
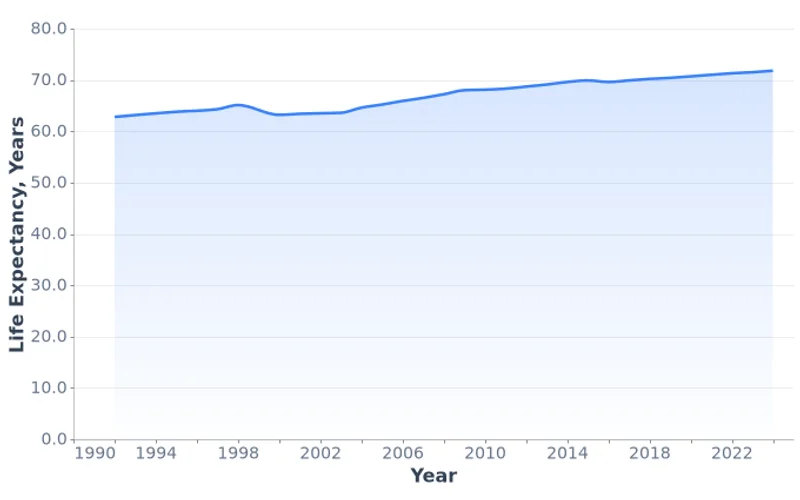
Life expectancy at birth in Mongolia rose from 62.8 years in 1992 to 71.8 years in 2024, reflecting steady improvements in public health over three decades.
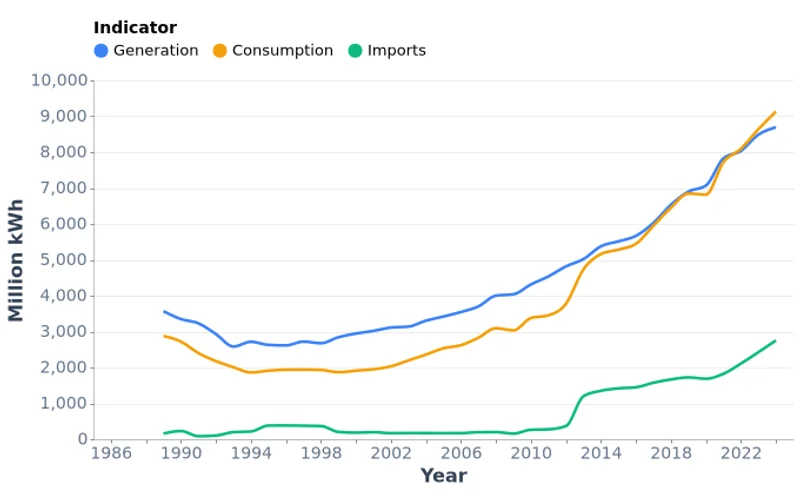
Annual electricity generation, imports, and consumption in Mongolia in million kWh from 1989 to 2024, showing the growing gap between domestic production and demand.
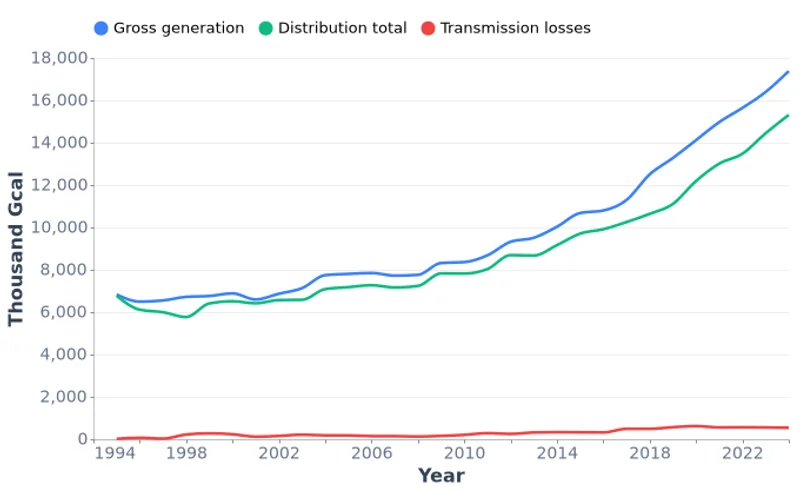
Mongolia's heating energy balance from 1995 to 2024. Gross generation rose from 6,832 to 17,383 thousand Gcal, driven by rapid urbanization and new residential construction.
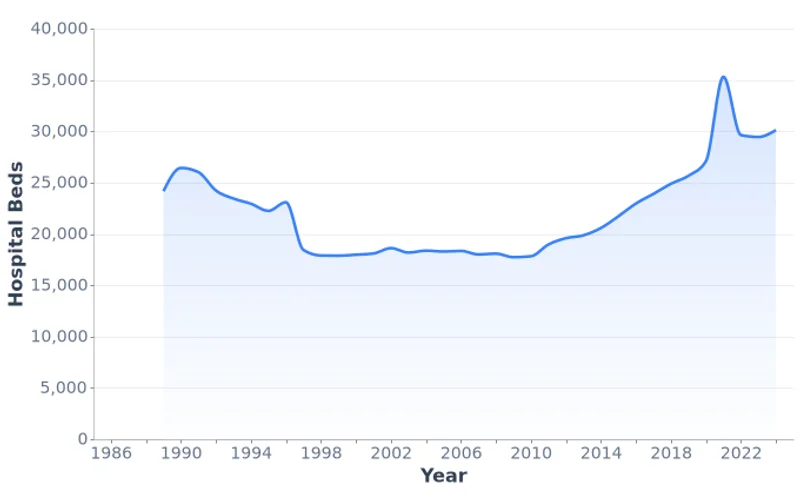
Total number of hospital beds in Mongolia from 1989 to 2024, showing healthcare infrastructure capacity over 35 years.
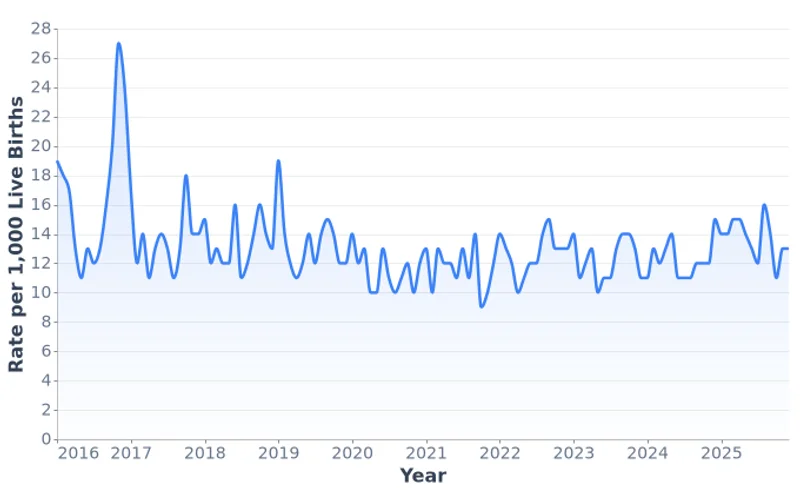
Monthly infant mortality rate per 1,000 live births in Mongolia from January 2016 to December 2025.
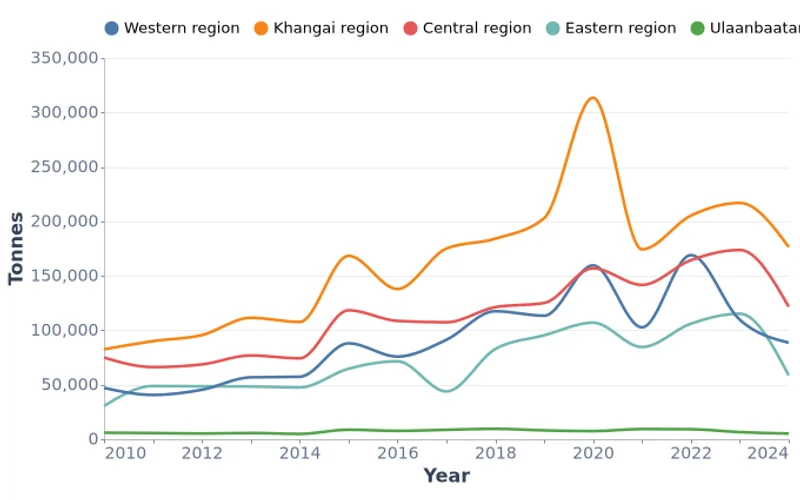
Annual meat production data for Mongolia's 5 main geographic regions from 2010 to 2024, measured in tonnes.
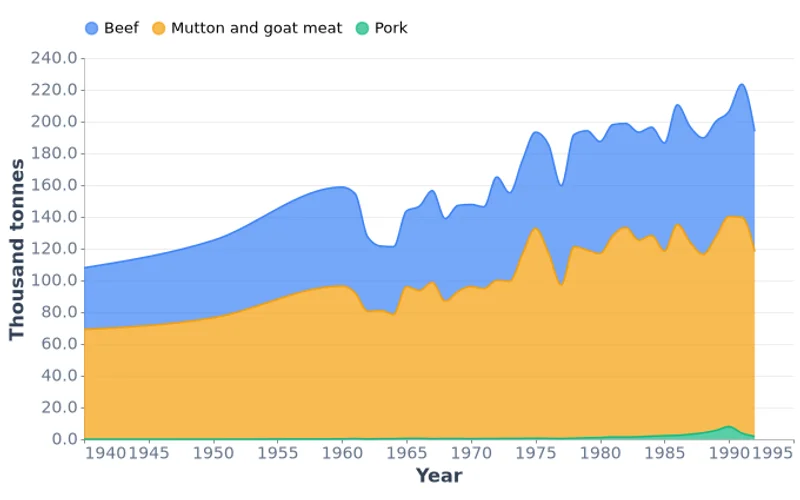
Historical meat production data for Mongolia showing beef, mutton and goat meat, and pork from 1940 to 1992.
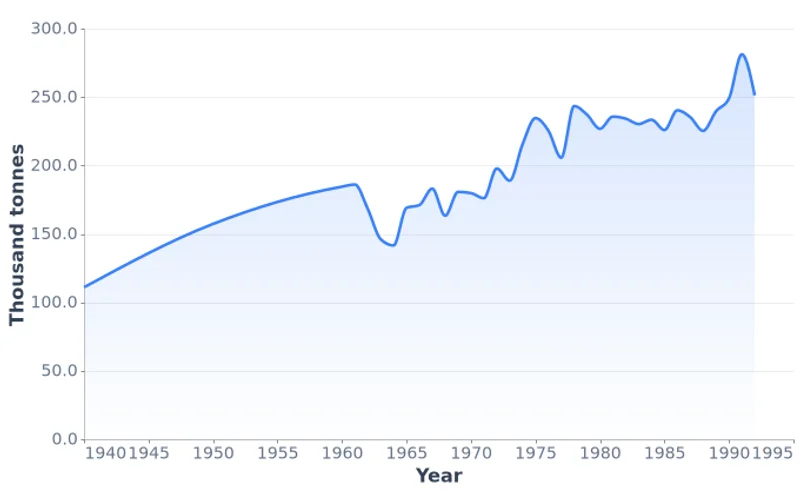
Total meat production in Mongolia from 1940 to 1992, measured in slaughter weight (thousand tonnes).
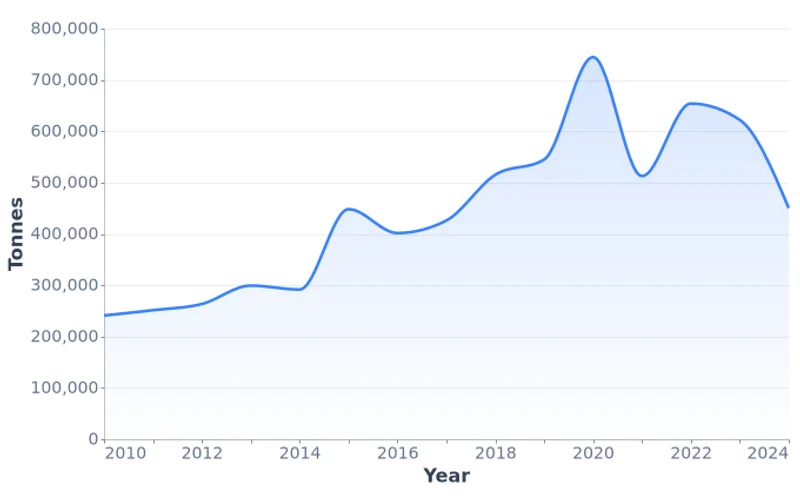
Total meat production in Mongolia from 2010 to 2024, measured in tonnes.
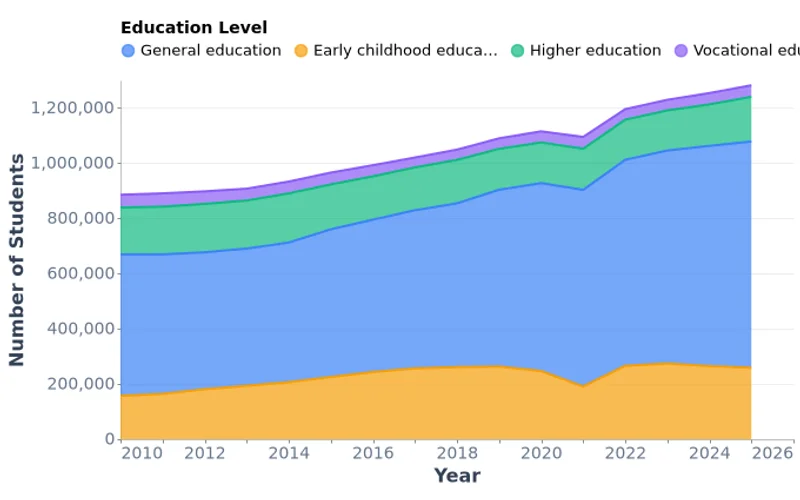
Number of students enrolled in educational institutions in Mongolia by education level — early childhood, general, vocational, and higher education — from 2010 to 2025.
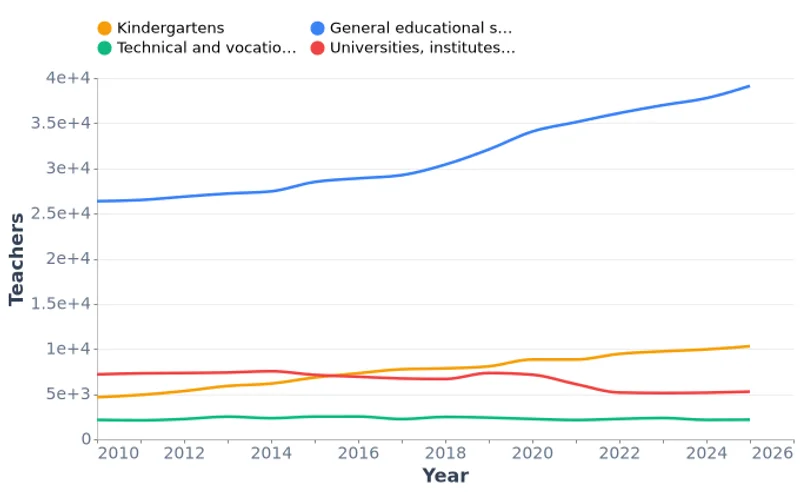
Number of full-time teachers in Mongolia by education level from 2010 to 2025, covering kindergartens, general schools, vocational institutions, and universities.
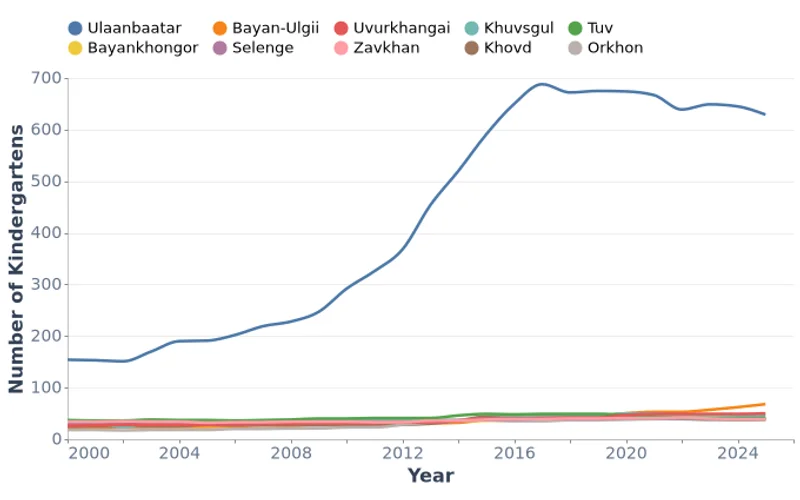
Number of kindergartens across 22 aimags and Ulaanbaatar in Mongolia from 2000 to 2025. Chart shows the top 10 regions by kindergarten count; full data for all aimags is available for download.
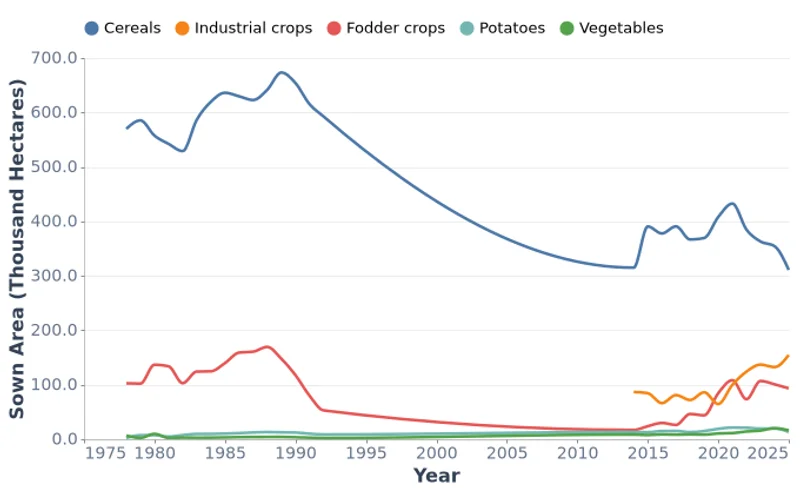
Annual sown area for five major crop categories in Mongolia from 1978 to 2025, including cereals, industrial crops, fodder crops, potatoes, and vegetables.
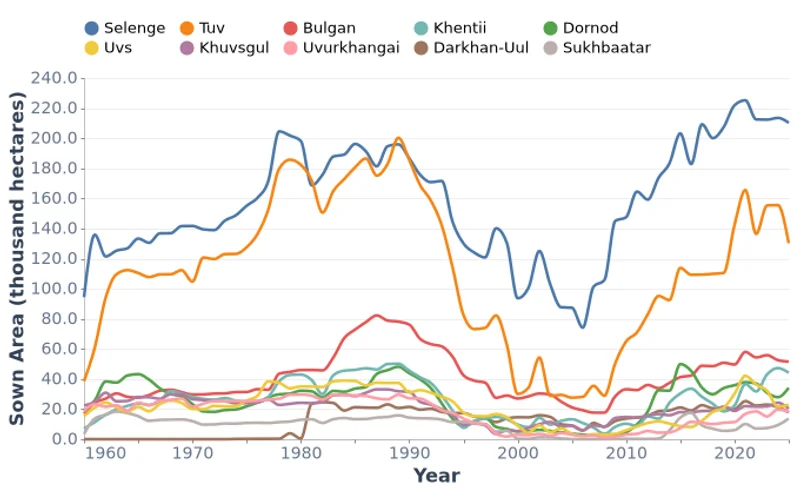
Total sown area across 22 regions of Mongolia from 1960 to 2025, measured in thousand hectares. Chart shows the top 10 regions; full data for all aimags is available for download.
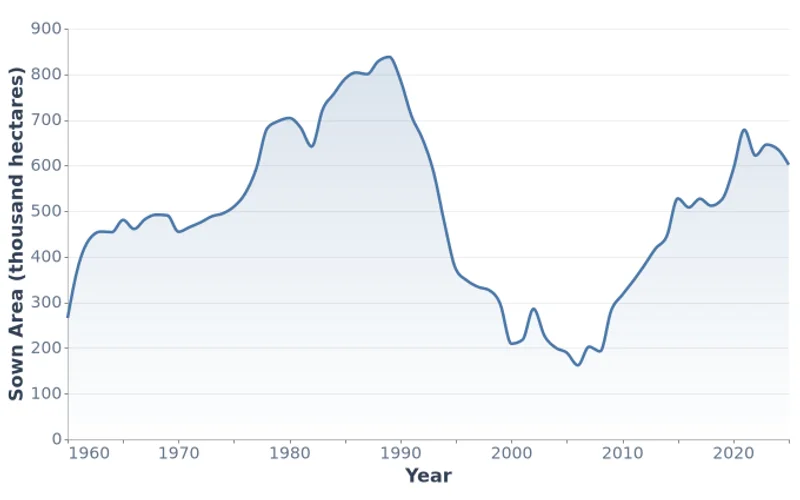
Annual total sown area in thousand hectares for Mongolia from 1960 to 2025, covering 66 years of national agricultural land use data from NSO.
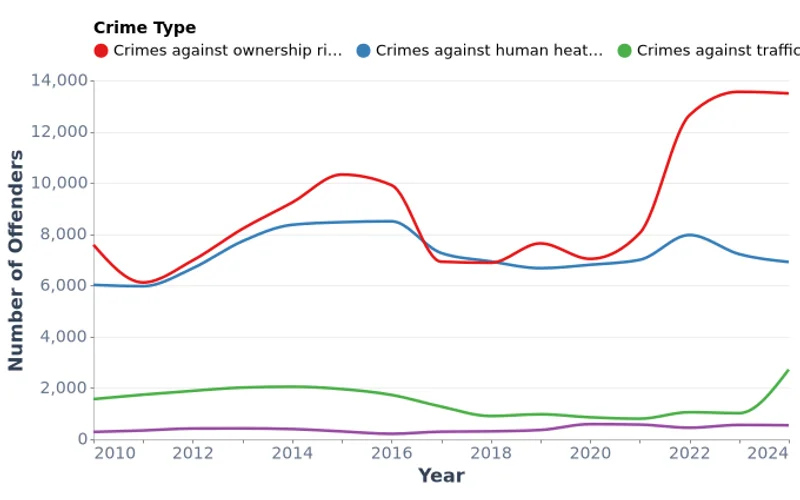
Number of crime offenders in Mongolia by classification of crimes from 2010 to 2024, covering 19 crime categories.
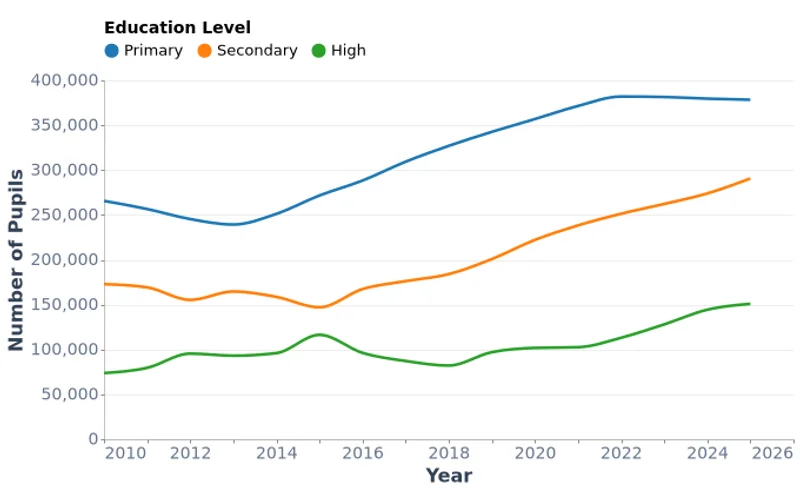
Total number of pupils studying in general educational schools in Mongolia by education level, ownership type, and sex from 2010 to 2025.
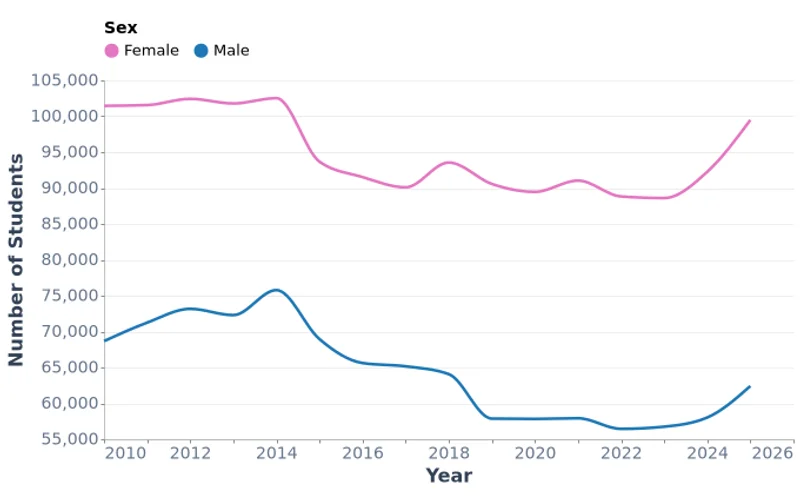
Number of students in universities, institutes and colleges in Mongolia by sex, aimags and the Capital from 2010 to 2025.
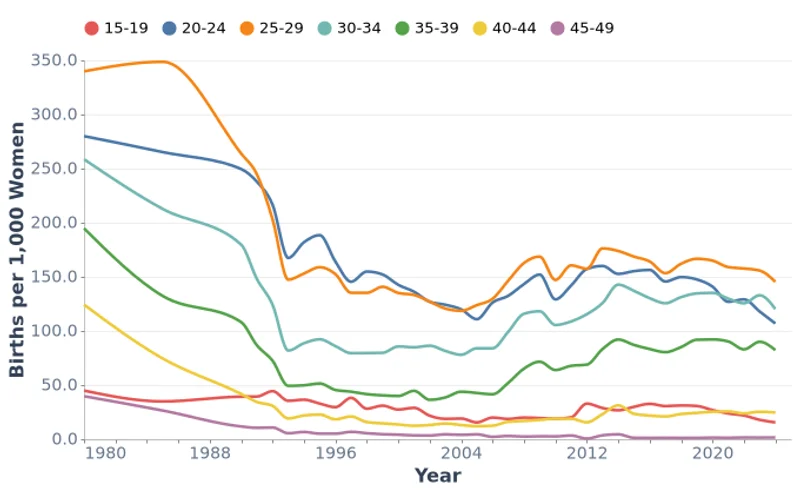
Age-specific birth rates per 1,000 women in Mongolia from 1980 to 2024, broken down by five-year age groups from 15-19 to 45-49.
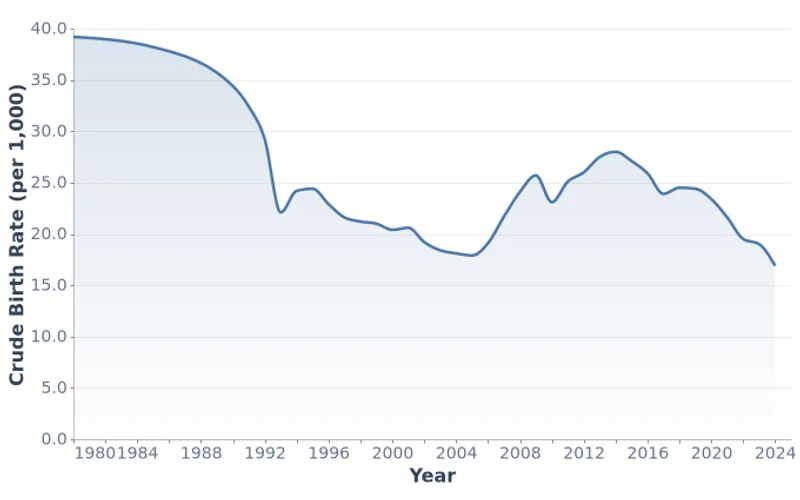
Annual crude birth rate per 1,000 population in Mongolia from 1980 to 2024.
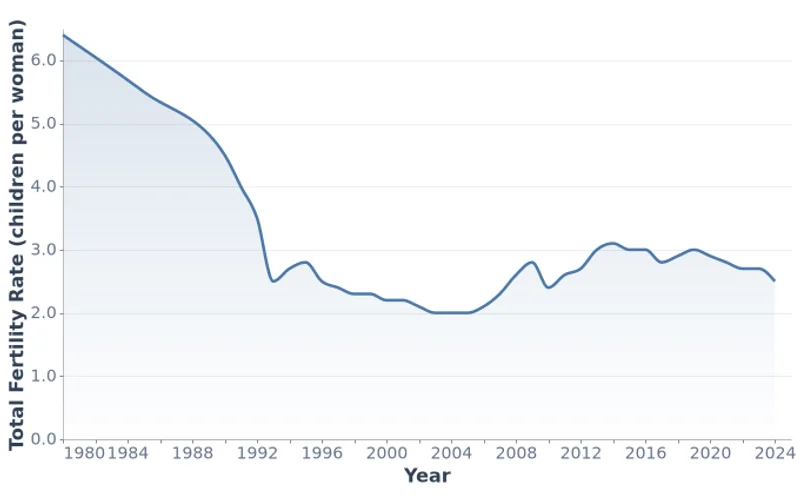
Annual total fertility rate (children per woman) in Mongolia from 1980 to 2024.
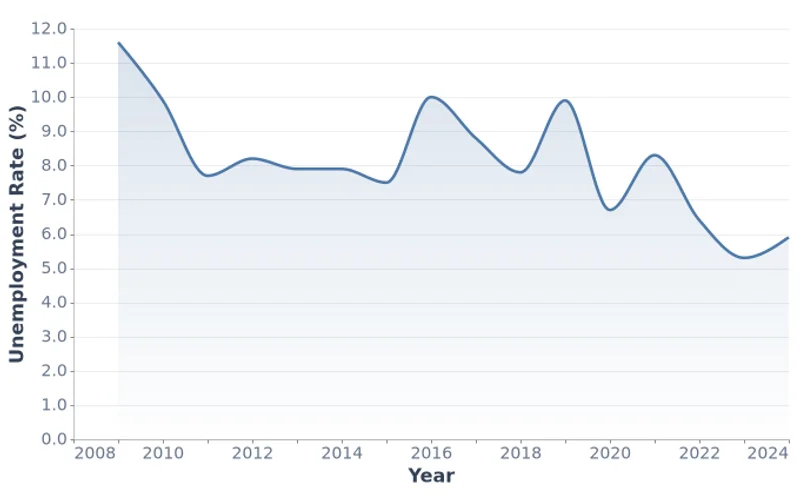
Annual unemployment rate (percentage of labor force) for Mongolia from 2009 to 2024.
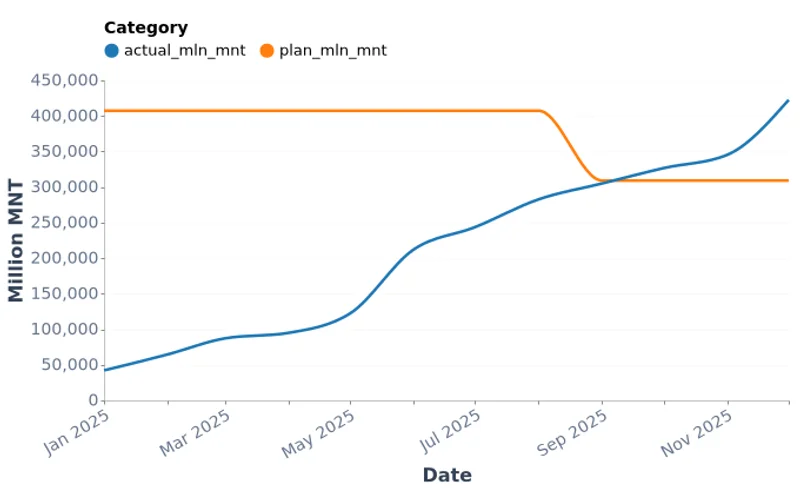
Monthly state budget revenue contributions from Mongolia's mining sector by revenue type from 2022 to 2025, measured in million MNT, showing plan vs actual performance. Data sourced from MRPAM monthly statistical reports.
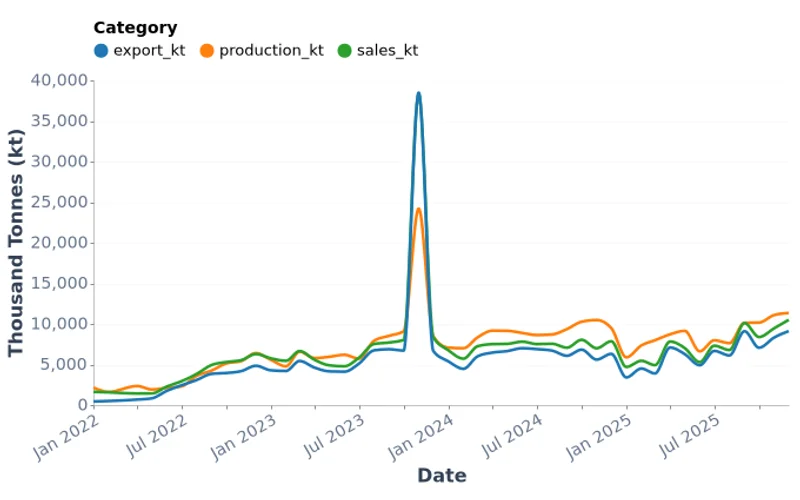
Monthly coal production, domestic sales, and export volumes in Mongolia from 2021 to 2025, measured in thousand tonnes (kt). Data sourced from MRPAM monthly statistical reports.
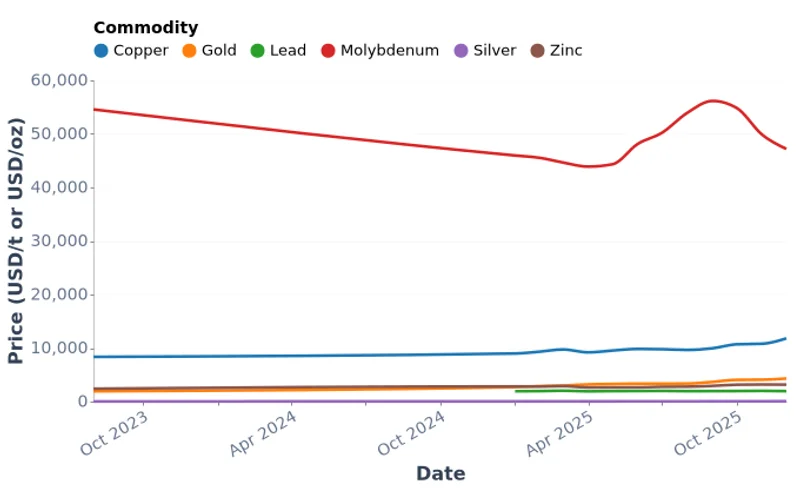
Monthly world market prices for key mineral commodities including gold, silver, copper, zinc, fluorspar, iron ore, and coal from 2022 to 2025. Data sourced from MRPAM monthly statistical reports.
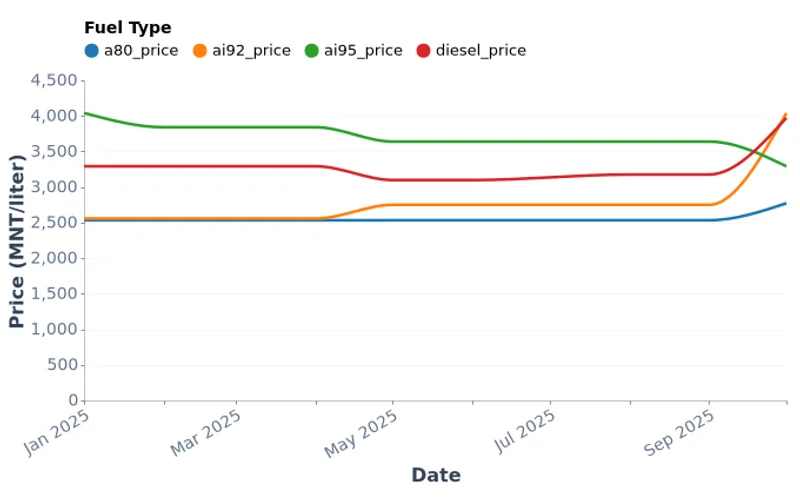
Monthly retail prices of gasoline (AI-92, AI-95) and diesel fuel across Mongolia's provinces from 2022 to 2025, measured in MNT per liter. Data sourced from MRPAM monthly statistical reports.
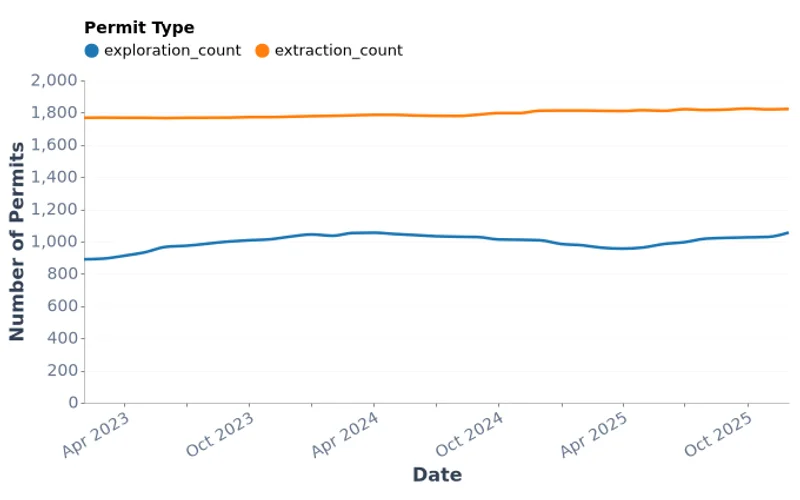
Monthly counts and total area (hectares) of exploration and extraction permits across Mongolia's provinces from 2022 to 2025. Data sourced from MRPAM monthly statistical reports.
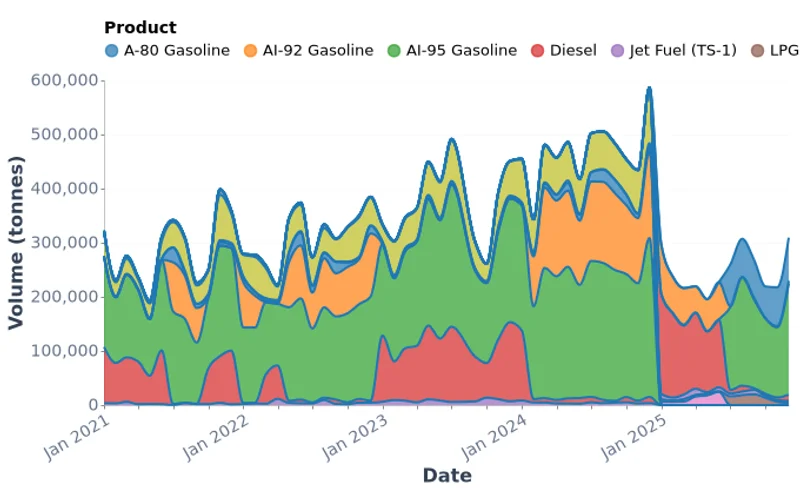
Monthly petroleum product imports into Mongolia by product type (gasoline, diesel, jet fuel, etc.) from 2022 to 2025, measured in thousand tonnes. Data sourced from MRPAM monthly statistical reports.
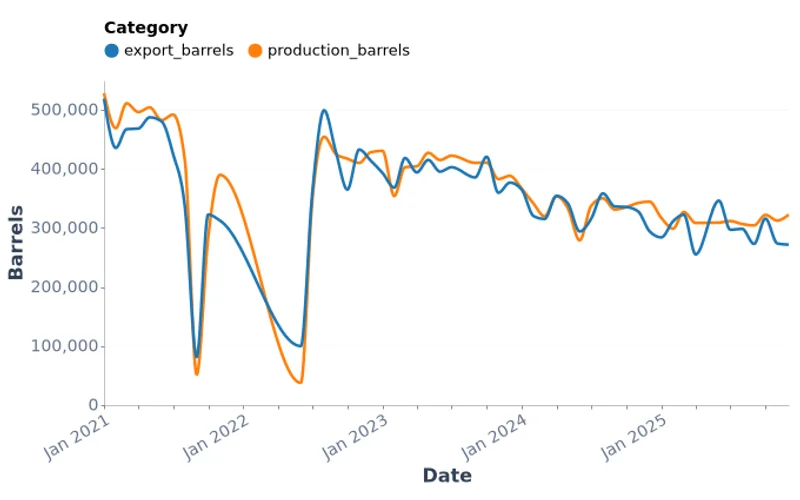
Monthly crude petroleum production and export volumes in Mongolia from 2022 to 2025, measured in barrels. Data sourced from MRPAM monthly statistical reports.
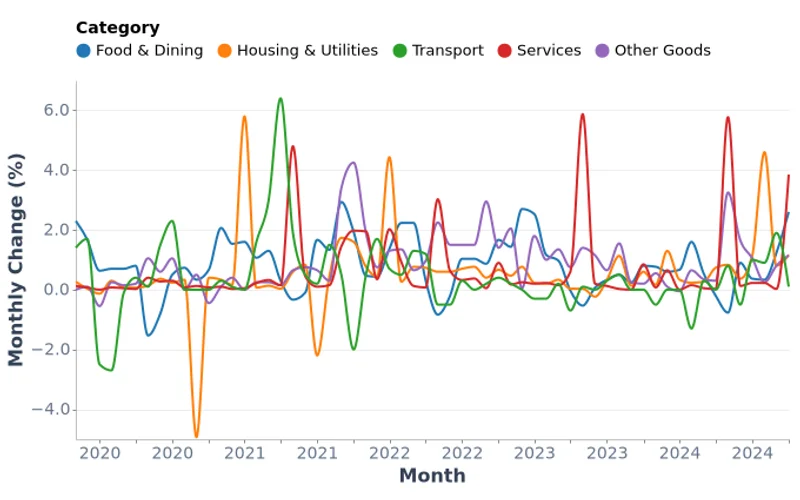
Monthly consumer price index data for 5 major spending categories in Ulaanbaatar from January 2020 to December 2025.
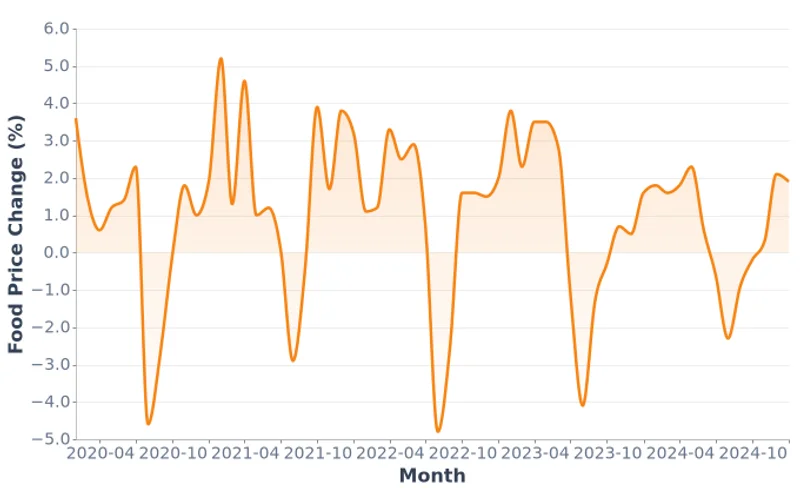
Monthly food price changes (month-over-month percentage) in Ulaanbaatar from February 2020 to present.
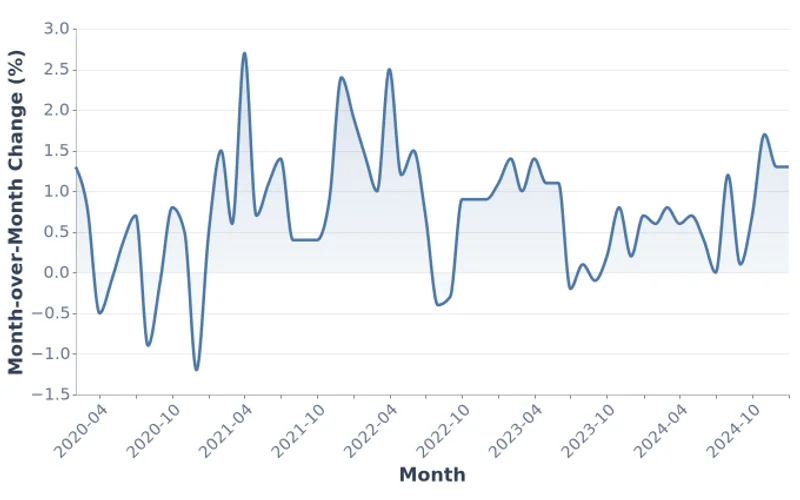
Monthly inflation rate (month-over-month CPI change) for Ulaanbaatar from February 2020 to present.
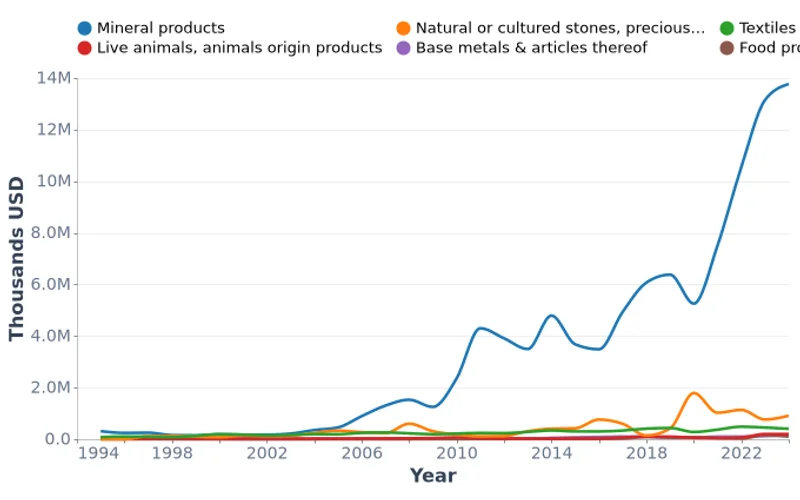
Mongolia exported $15.8 billion in goods in 2024, with mineral products accounting for 87% of total exports.
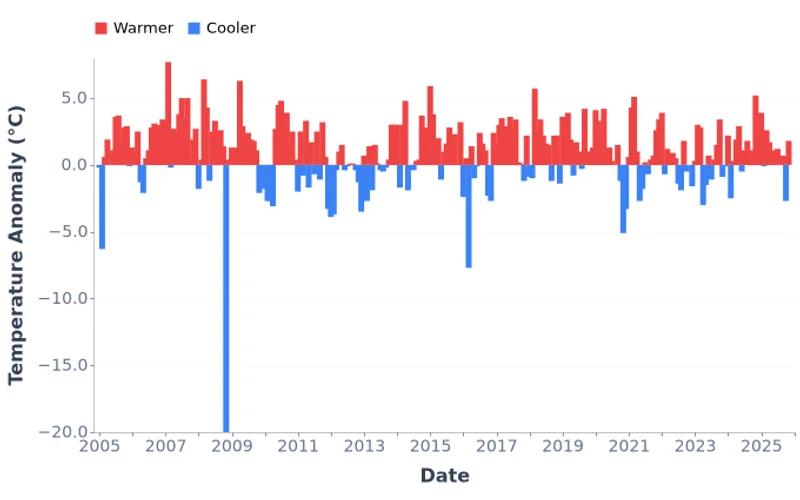
Monthly temperature anomaly data for Ulaanbaatar from 2005 to 2024, measured against the 1981-2010 baseline average.
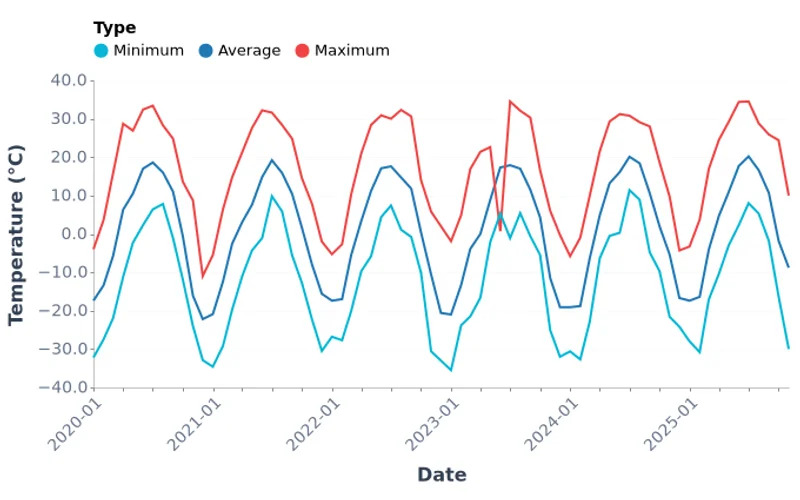
Monthly minimum and maximum temperature extremes recorded in Ulaanbaatar from 2005 to 2025, in degrees Celsius.
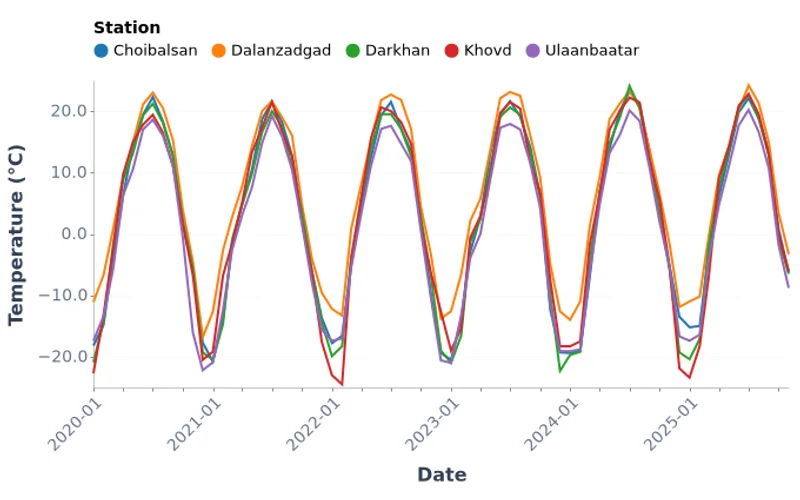
Monthly average temperature from 5 major weather stations in Mongolia: Ulaanbaatar, Darkhan, Dalanzadgad, Choibalsan, and Khovd, from 2005 to 2025.
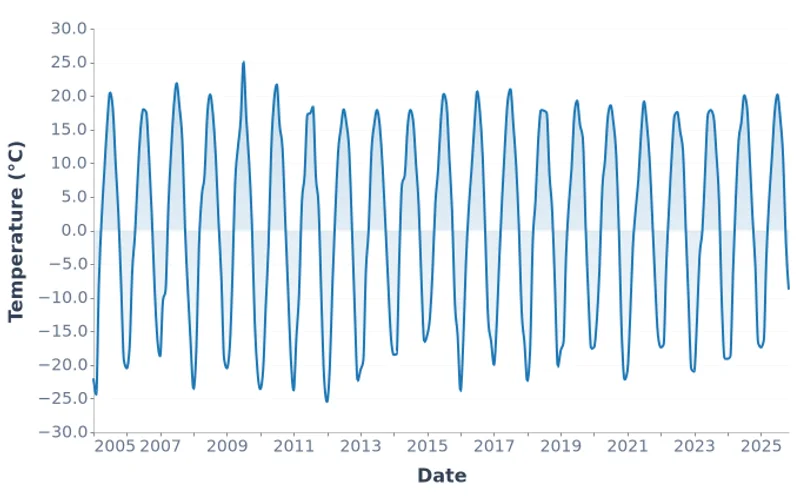
Monthly average temperature in Ulaanbaatar from 2005 to 2025, measured in degrees Celsius.
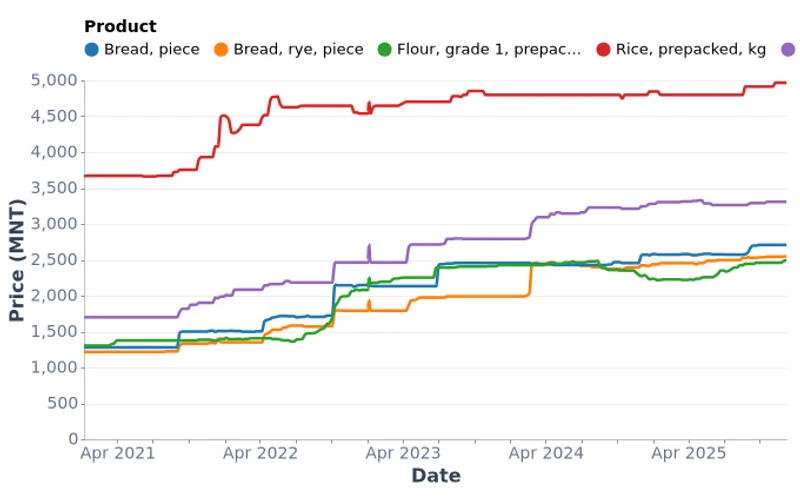
Weekly prices for bread, flour, and rice in Ulaanbaatar from 2021 to present.
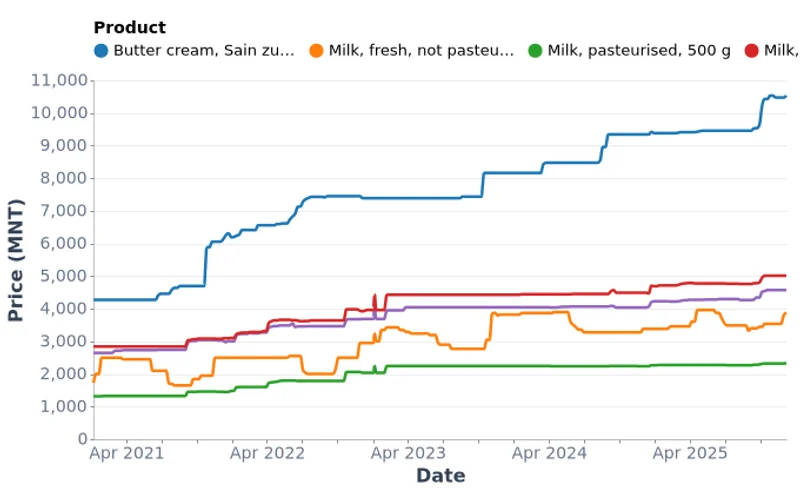
Weekly prices for dairy products in Ulaanbaatar from 2021 to present, including fresh milk, pasteurized milk, yoghurt, and butter cream.
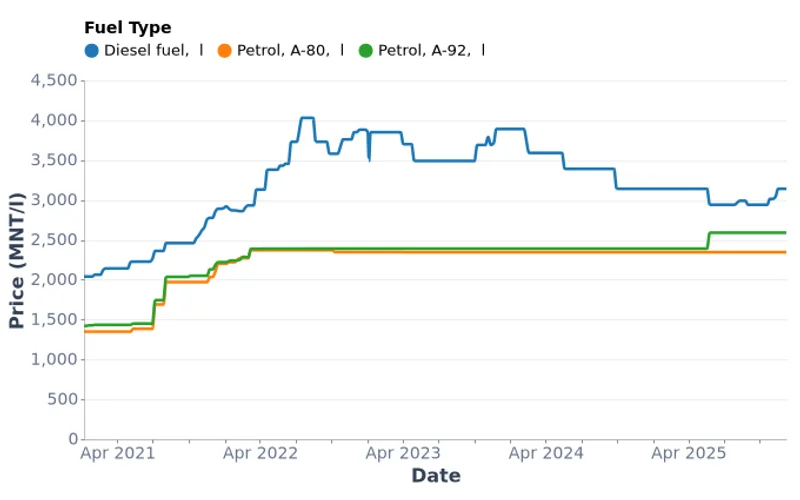
Weekly prices for fuel in Ulaanbaatar from 2021 to present, including petrol (A-80, A-92) and diesel.
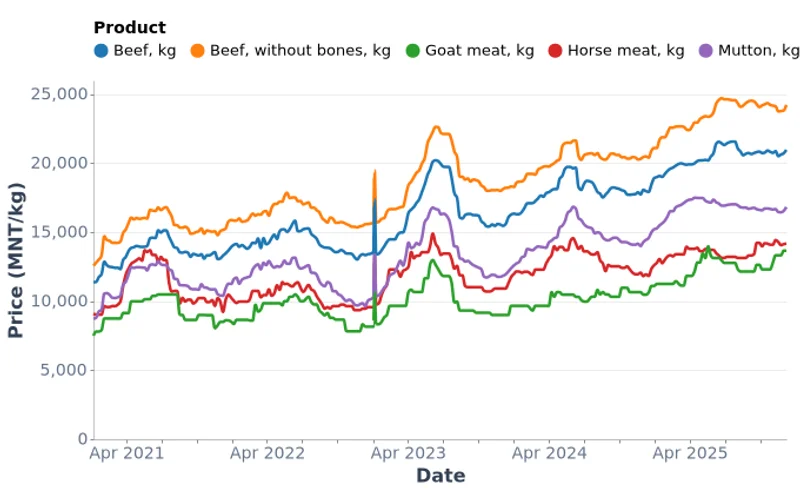
Weekly prices for mutton, beef, horse meat, and goat meat in Ulaanbaatar from 2021 to present.
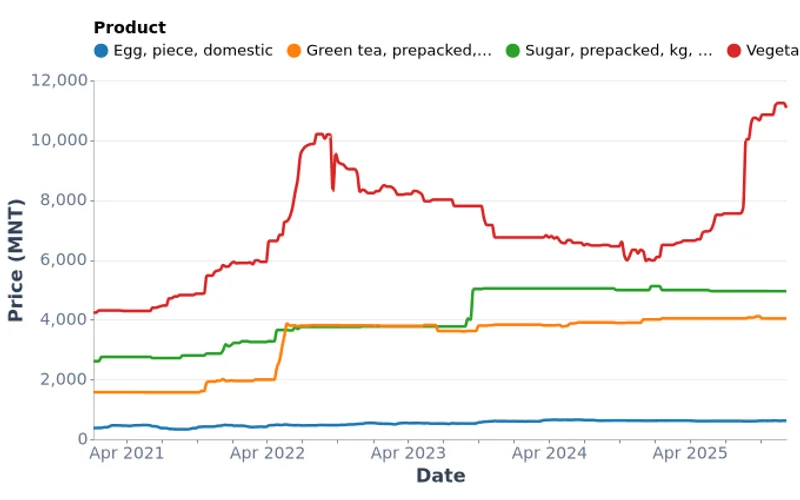
Weekly prices for common grocery items in Ulaanbaatar from 2021 to present, including vegetable oil, sugar, green tea, and eggs.
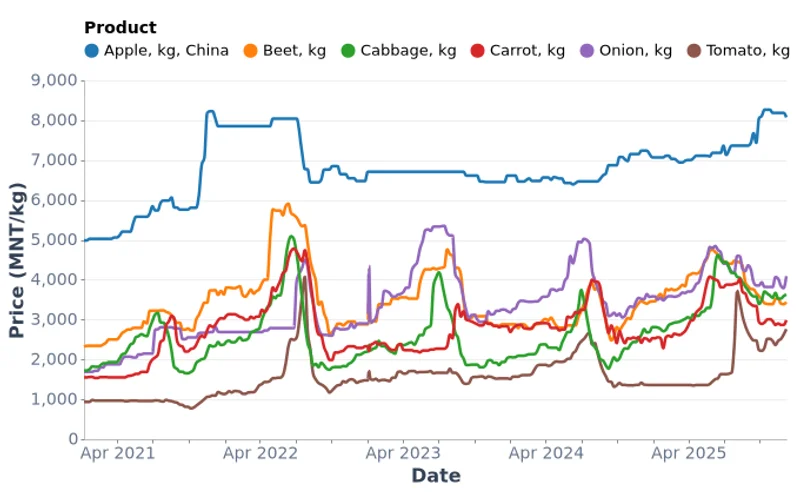
Weekly prices for vegetables and fruits in Ulaanbaatar from 2021 to present, including potatoes, carrots, cabbage, onions, beets, and apples.
Quarterly net foreign direct investment flows in million USD for Mongolia from 2009 to 2025.
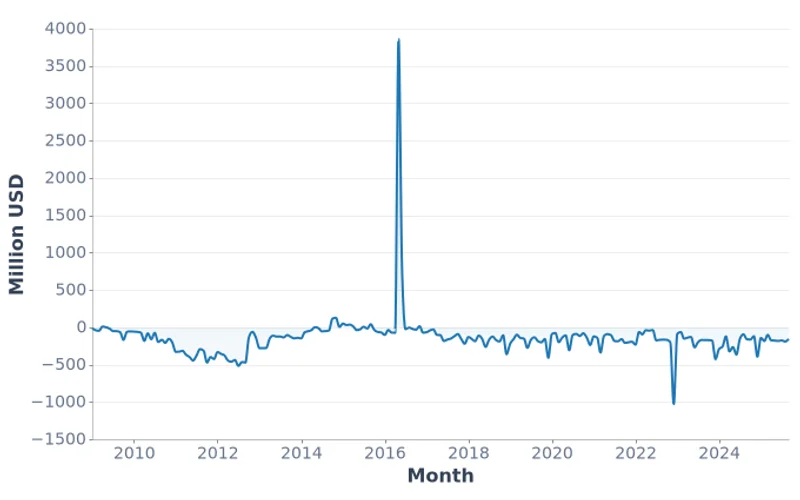
Quarterly current account balance in million USD for Mongolia from 2009 to 2025.
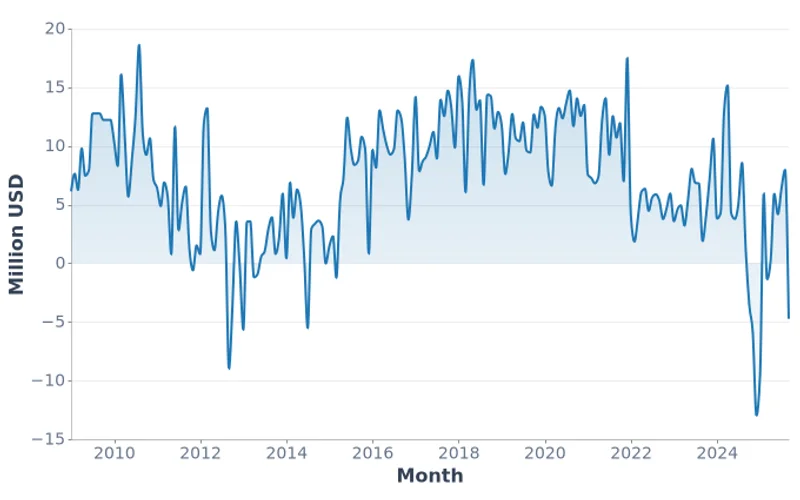
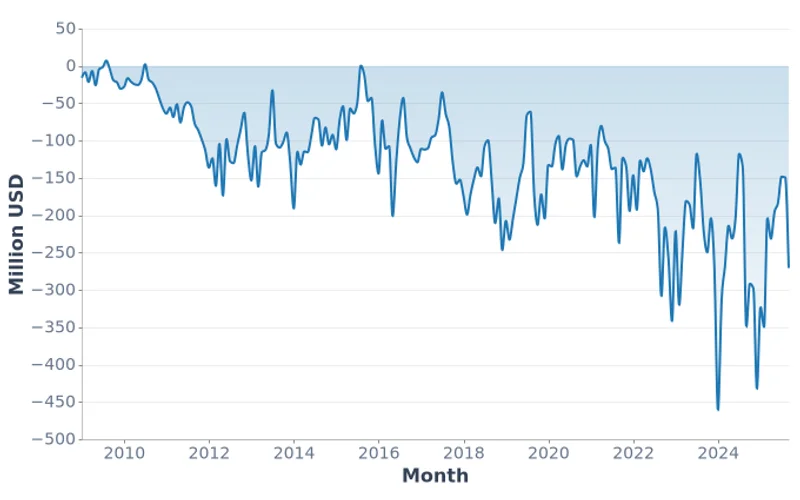
Personal remittances recorded a net outflow of $4.7M in September 2025, showing transfers between Mongolians abroad and their families.
Quarterly changes in official reserve assets in million USD for Mongolia from 2009 to 2025.
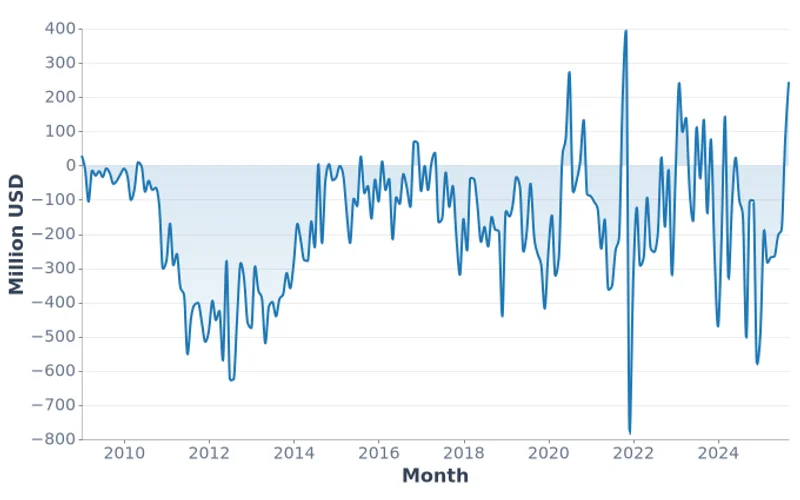
Quarterly services trade balance in million USD for Mongolia from 2009 to 2025.
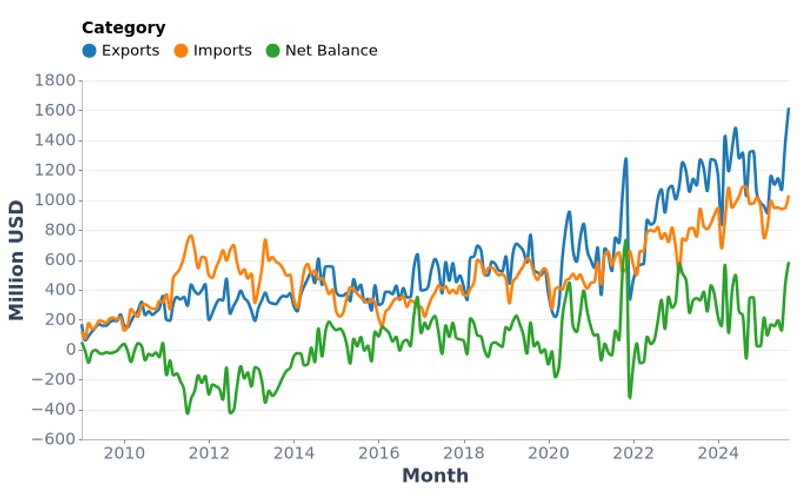
Mongolia exported $1,617.3M and imported $1,032.0M worth of goods in September 2025, resulting in a trade surplus of $585.3M.
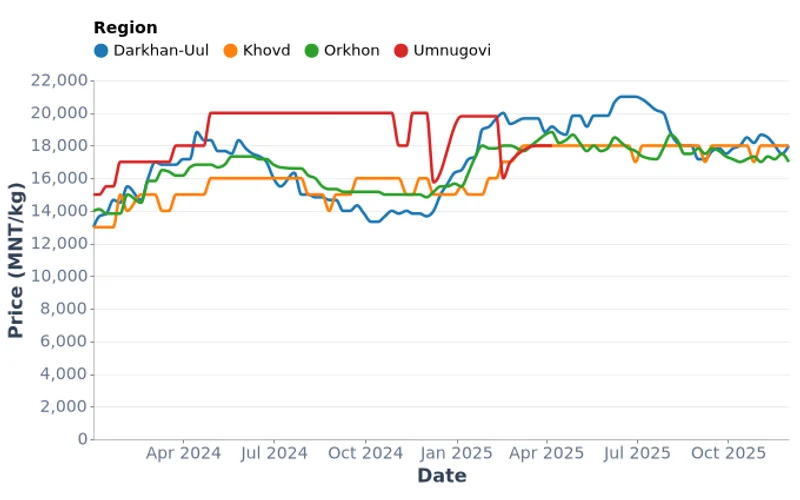
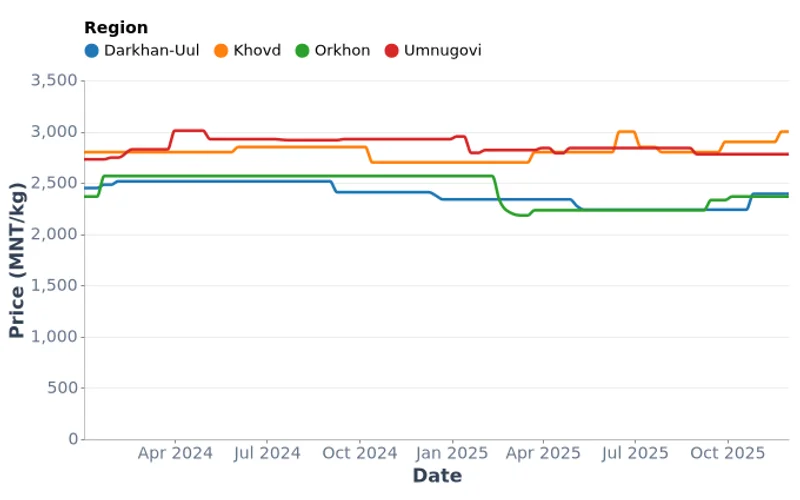
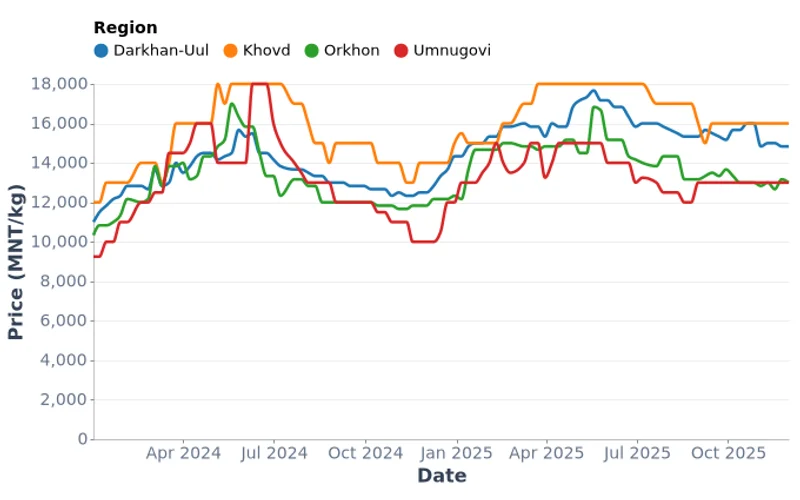
Weekly beef prices (MNT/kg) by region in Mongolia from 2024 to present, covering all 21 aimags and Ulaanbaatar.
Weekly flour prices (MNT/kg) by region in Mongolia from 2024 to present, covering all 21 aimags and Ulaanbaatar.
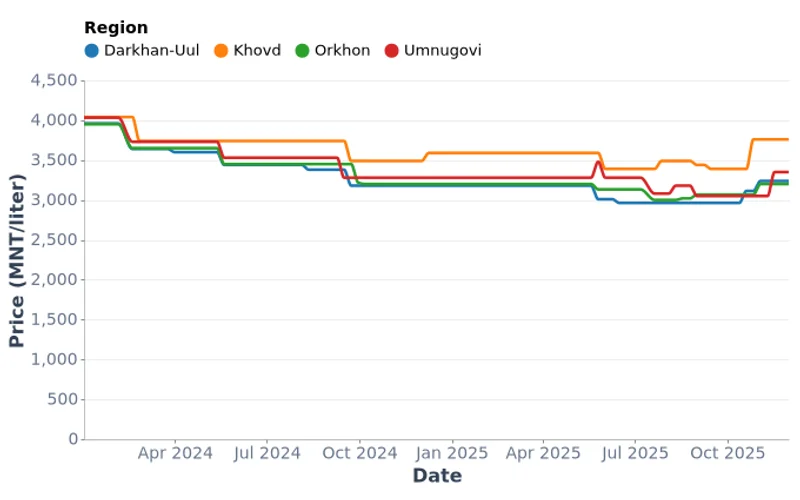
Weekly diesel prices (MNT/liter) by region in Mongolia from 2024 to present, covering all 21 aimags and Ulaanbaatar.
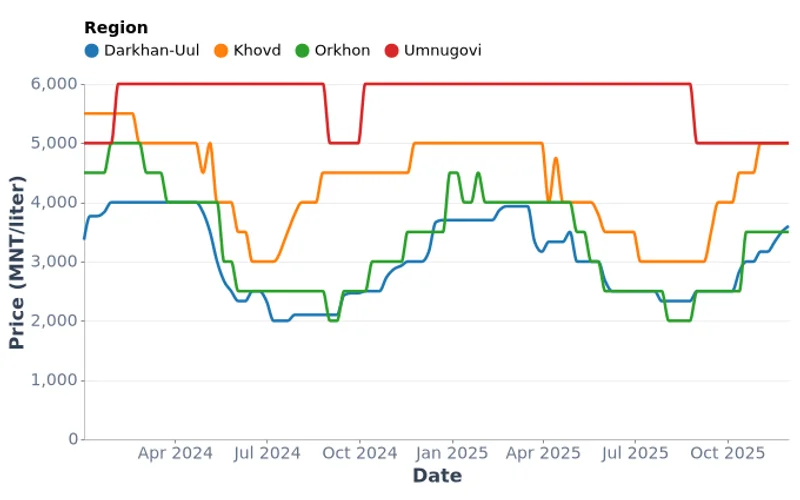
Weekly A-92 gasoline prices (MNT/liter) by region in Mongolia from 2024 to present, covering all 21 aimags and Ulaanbaatar.
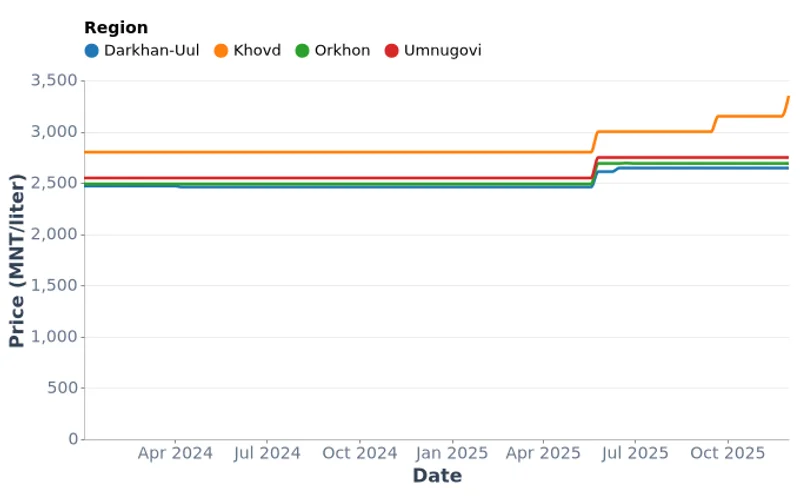
Weekly fresh milk prices (MNT/liter) by region in Mongolia from 2024 to present, covering all 21 aimags and Ulaanbaatar.
Weekly mutton prices (MNT/kg) by region in Mongolia from 2024 to present, covering all 21 aimags and Ulaanbaatar.
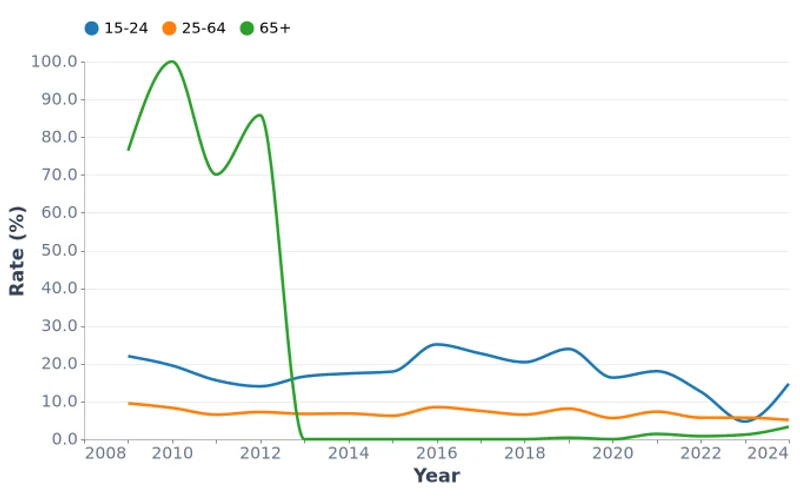
Unemployment rate by age group in Mongolia (15-24, 25-64, 65+) from 2009 to 2024.
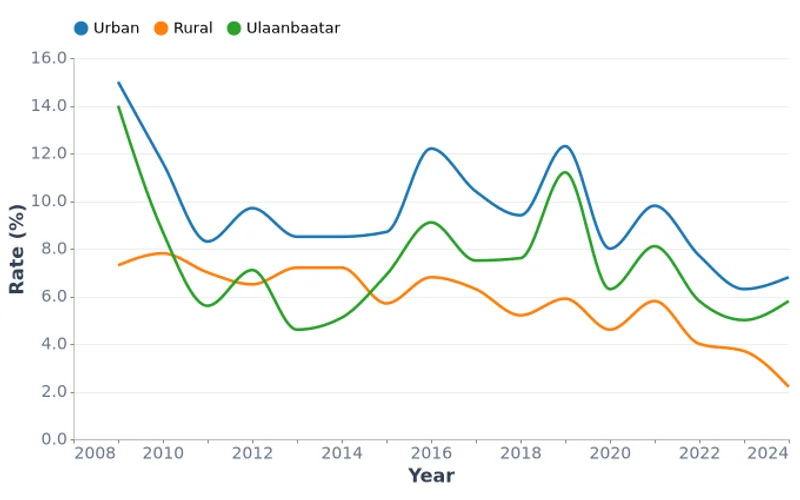
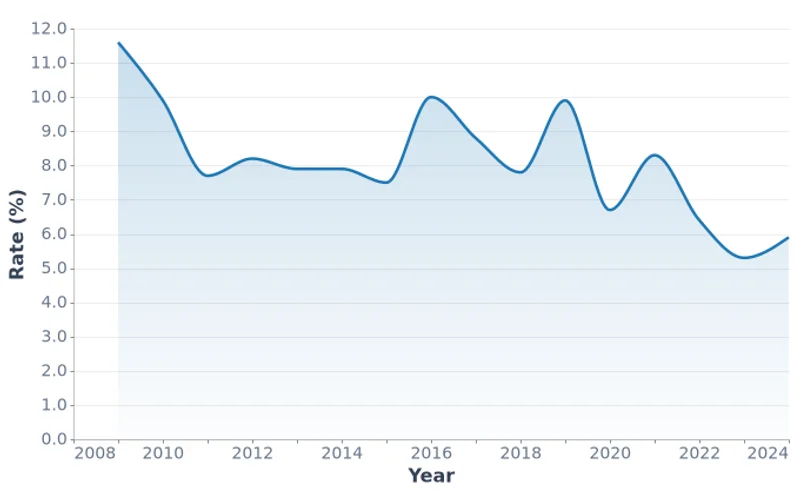
Unemployment rate by urban/rural areas and Ulaanbaatar from 2009 to 2024.
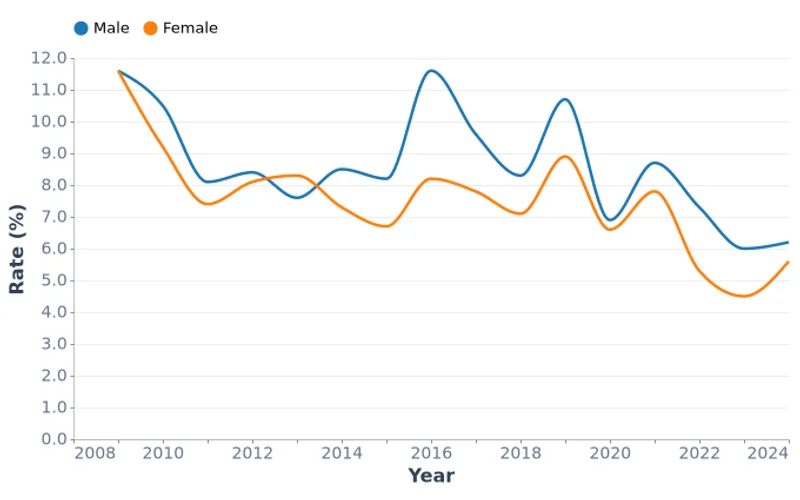
Unemployment rate in Mongolia by sex (male vs female) from 2009 to 2024.
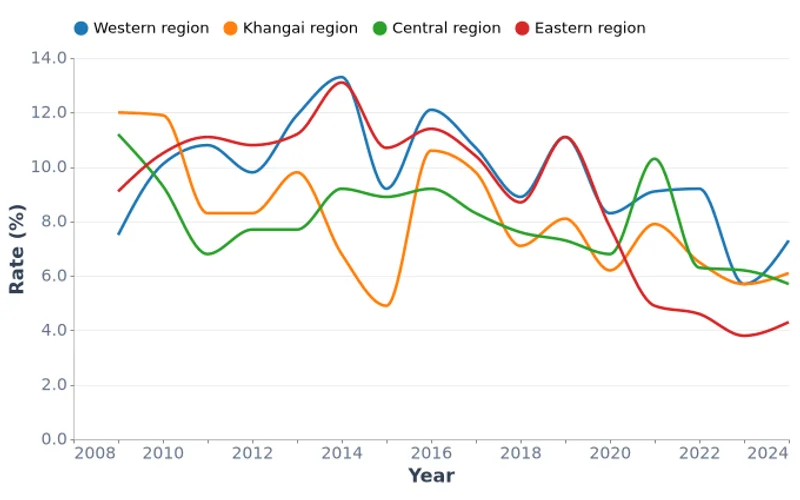
Unemployment rate by geographic region in Mongolia (Central, Western, Khangai, Eastern) from 2009 to 2024.
Annual unemployment rate (percentage of labor force) for Mongolia from 2009 to 2024.
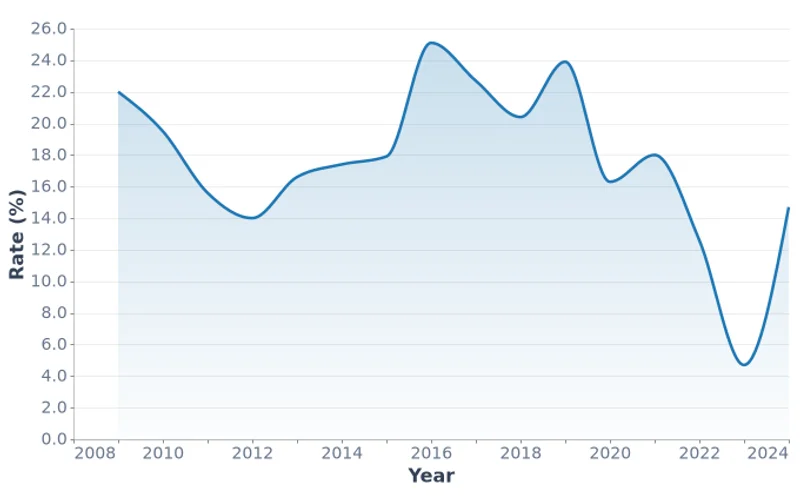
Unemployment rate among young people aged 15-24 in Mongolia from 2009 to 2024.
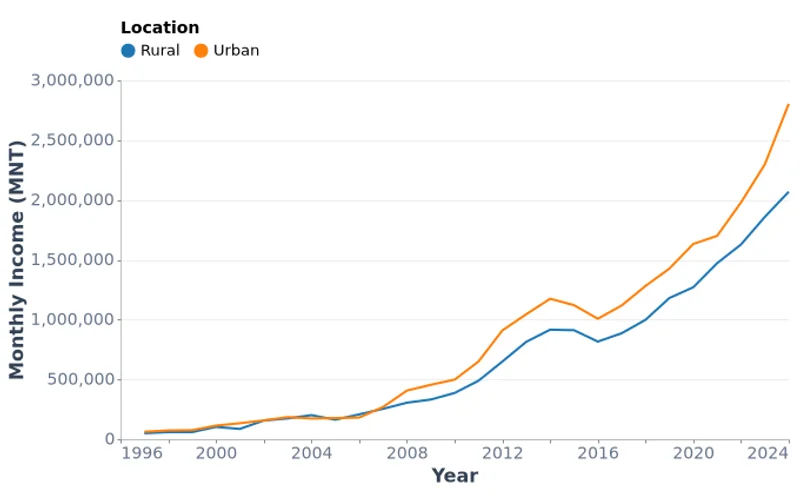
Comparison of average monthly household income in Mongolian Tugrik (MNT) between urban and rural areas from 1997 to 2024.
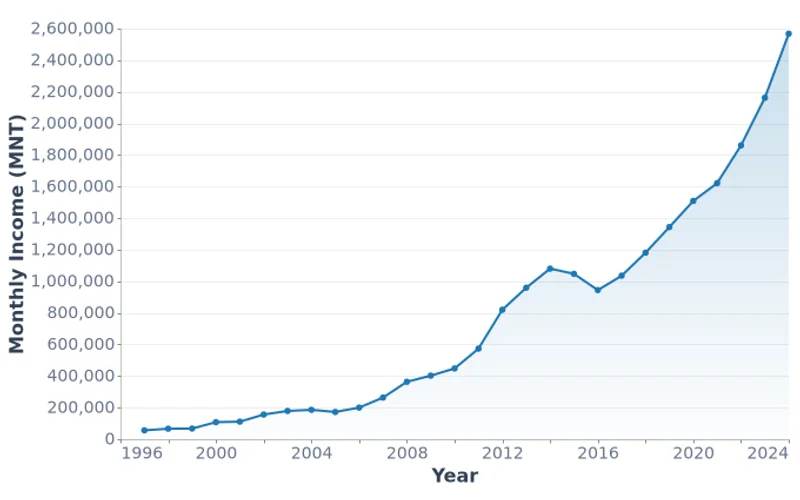
Annual average monthly household income in Mongolian tugrik (MNT) for Mongolia from 1997 to 2024.
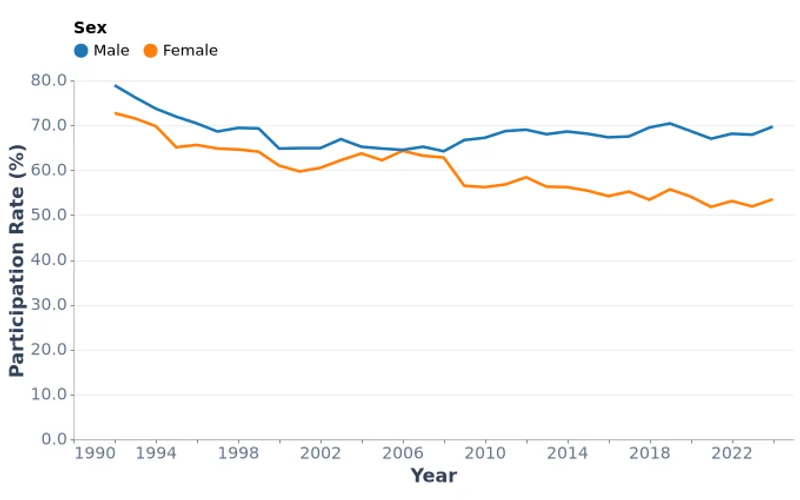
Mongolia's labour force participation rate from 1992 to 2024, broken down by male and female workers.
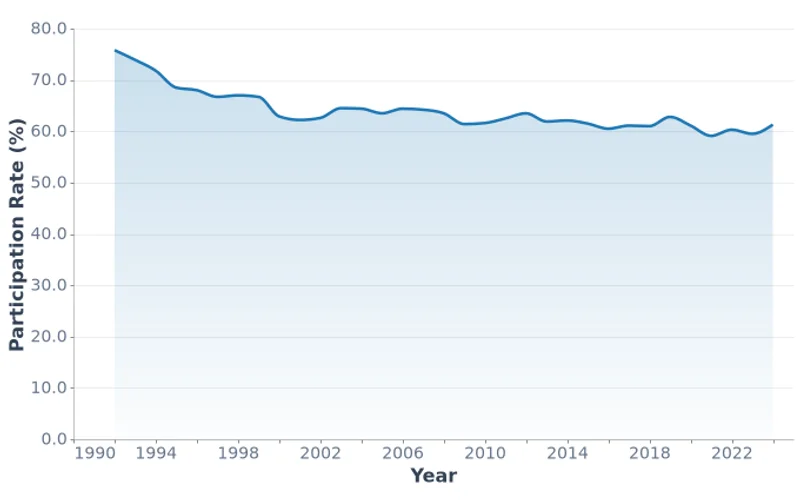
Mongolia's labour force participation rate from 1992 to 2024, showing the percentage of the working-age population that is economically active.
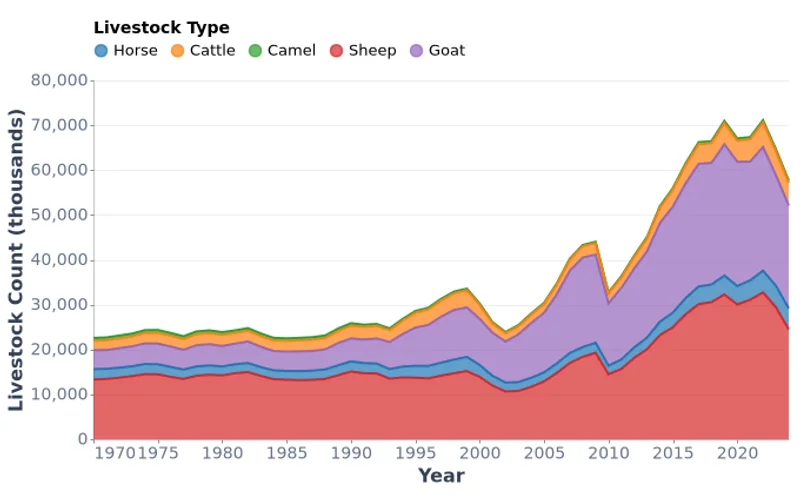
Annual livestock count by type (horse, cattle, camel, sheep, goat) in millions of head for Mongolia from 1970 to 2024.
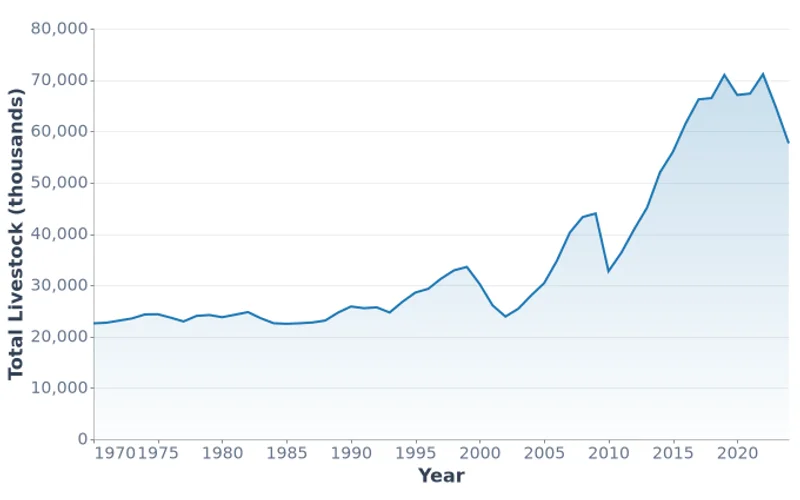
Annual total livestock count (millions of head) for Mongolia from 1970 to 2024.
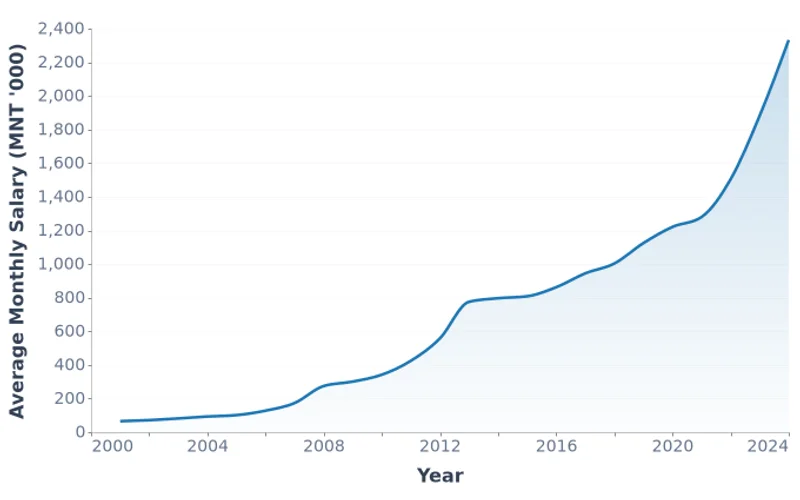
Annual average monthly salary in Mongolian tugrik (MNT) for Mongolia from 2001 to 2024.
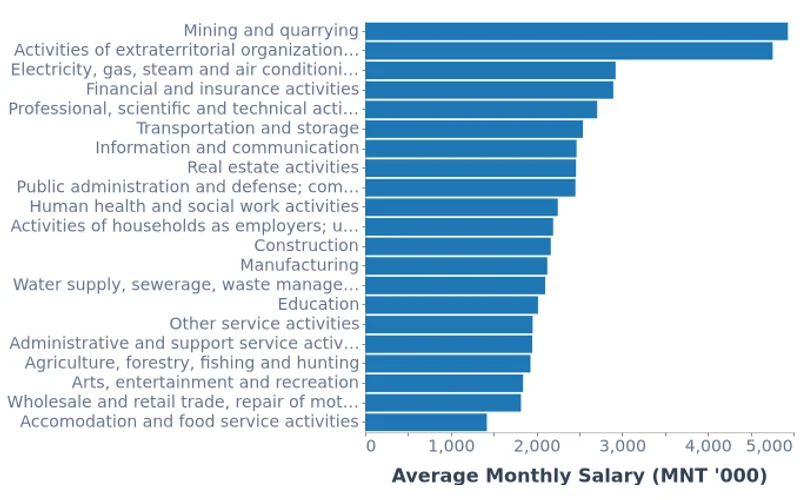
Average monthly salary by economic sector in Mongolian tugrik (MNT) for Mongolia in 2024.
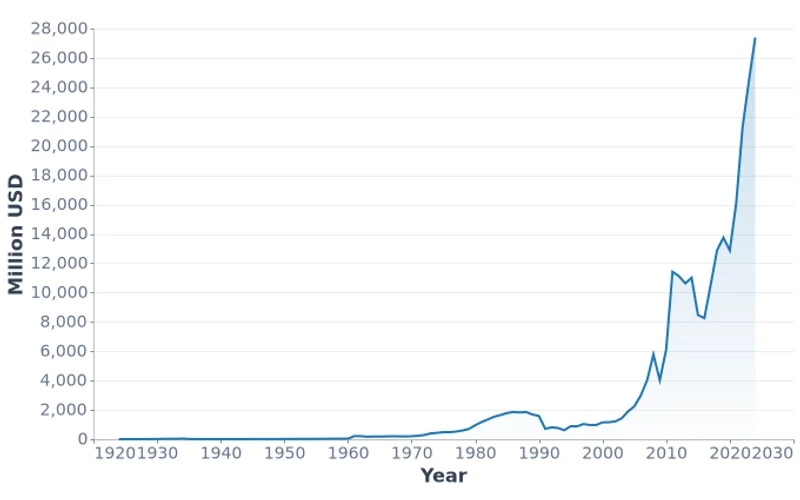
Mongolia's total foreign trade turnover from 1924 to 2024, showing the combined value of exports and imports in million USD.
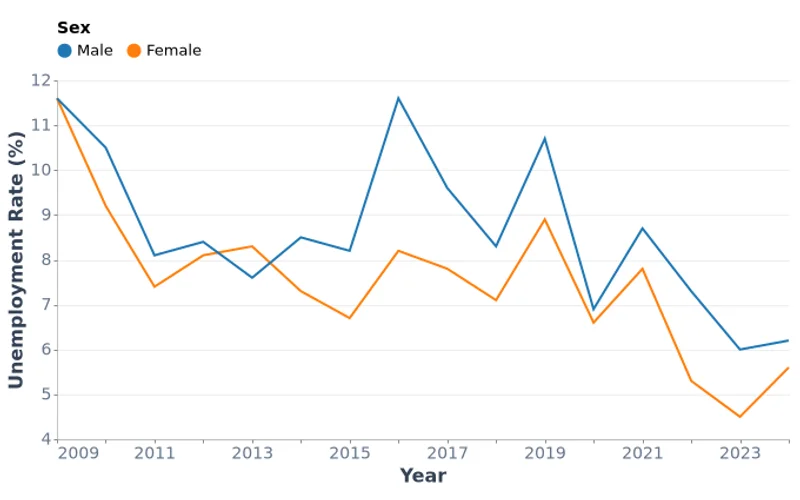
Unemployment rate in Mongolia disaggregated by sex (male and female) from 2009 to 2024.
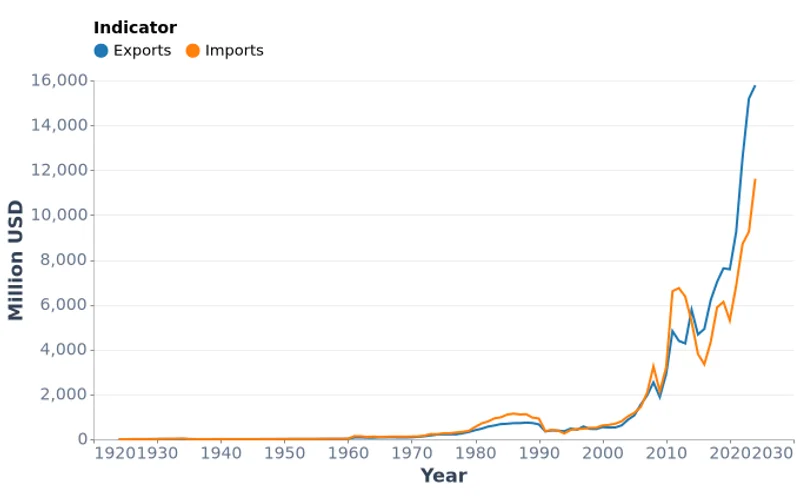
Mongolia's exports and imports from 1924 to 2024, showing the breakdown of foreign trade by direction in million USD.
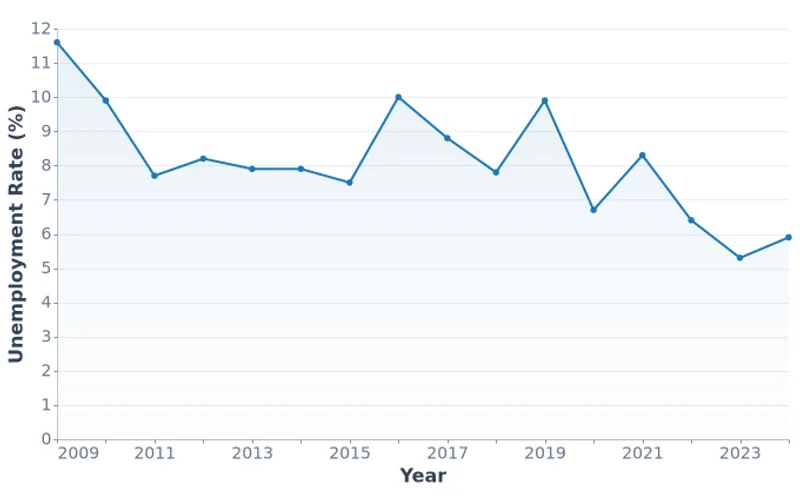
Annual unemployment rate (percentage of labor force) for Mongolia from 2009 to 2024.
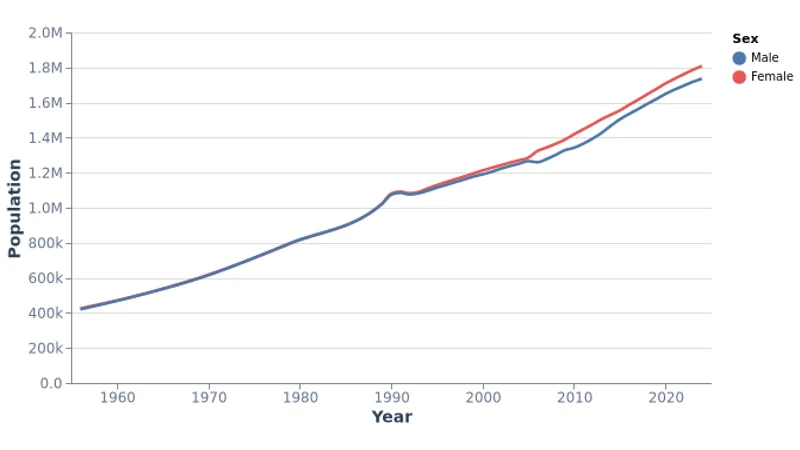
Annual population figures for Mongolia from 1956 to 2024, broken down by sex (male and female).
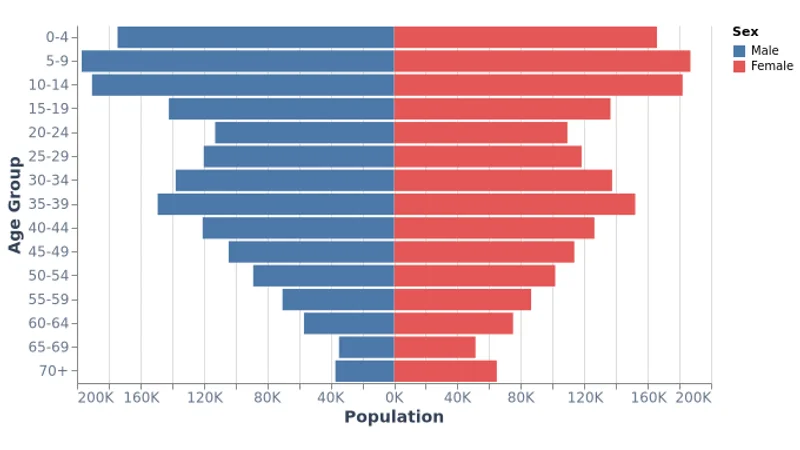
Population distribution by age group and sex for Mongolia in 2024, from age 0 to 100+.
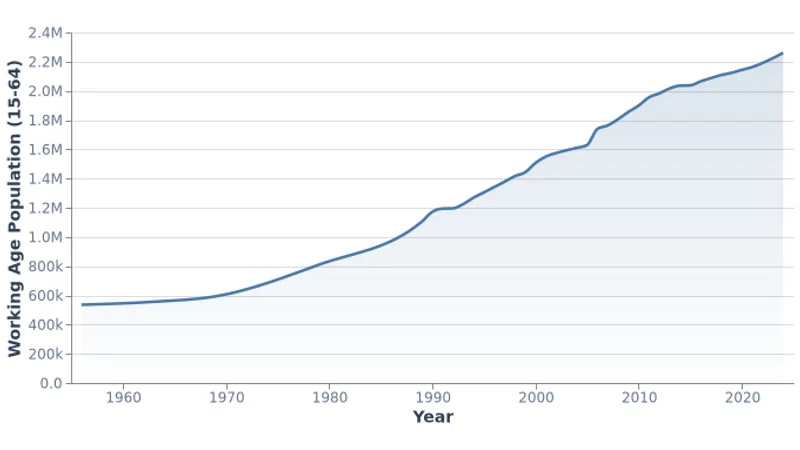
Annual working age population (ages 15-64) for Mongolia from 1956 to 2024.
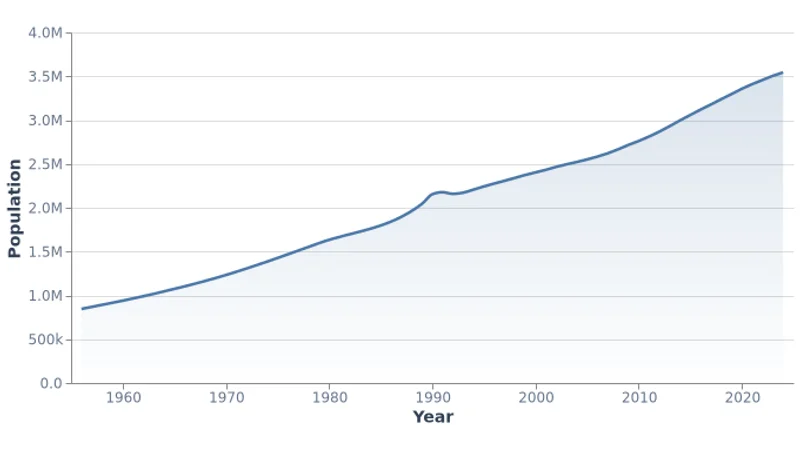
Annual total population figures for Mongolia from 1956 to 2024.
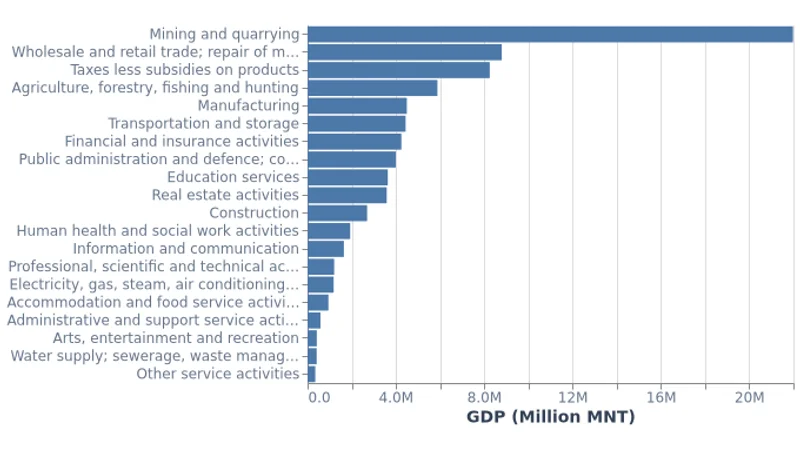
GDP breakdown by economic sector for Mongolia in 2024, covering all major industries including mining, trade, agriculture, and services.
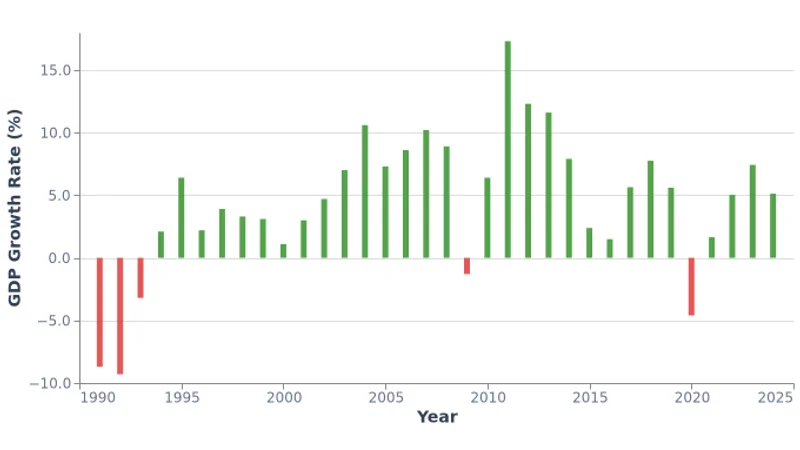
Annual GDP growth rate (year-over-year percentage change) for Mongolia from 1991 to 2024.
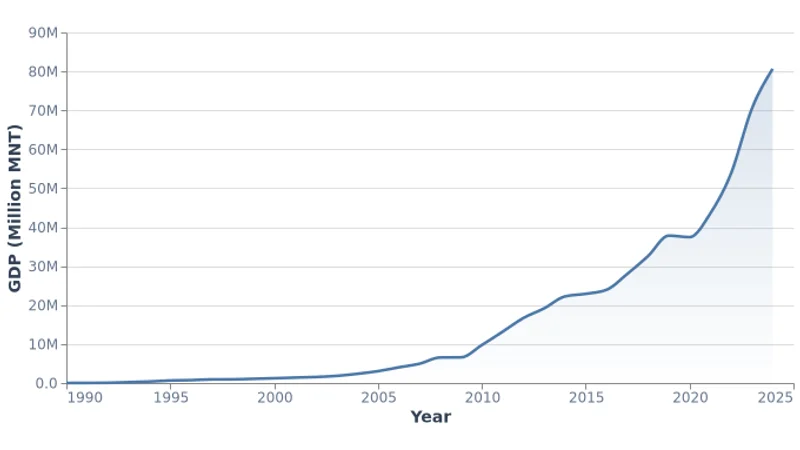
Annual nominal GDP at current prices in Mongolian tugrik (MNT) for Mongolia from 1990 to 2024.
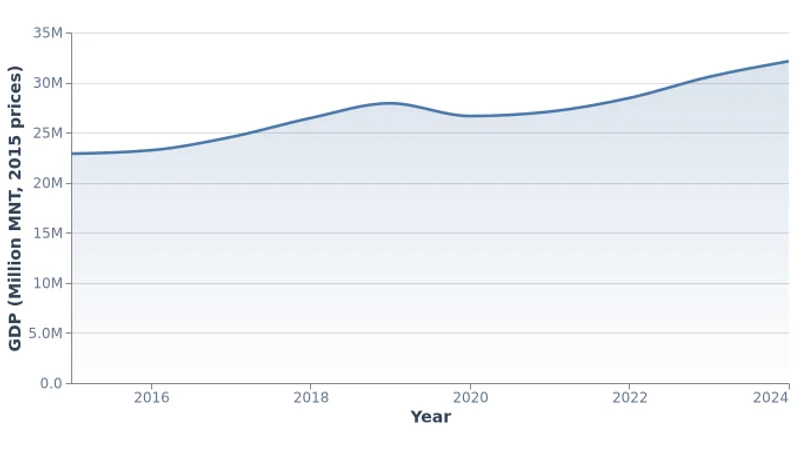
Annual real GDP at constant 2015 prices in Mongolian tugrik (MNT) for Mongolia from 2015 to 2024.
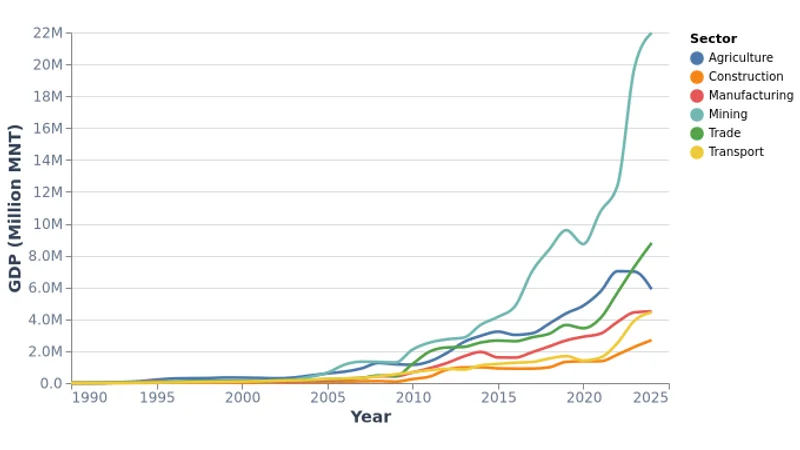
Annual GDP by major economic sectors in Mongolia from 1990 to 2024, covering mining, agriculture, services, and industry.
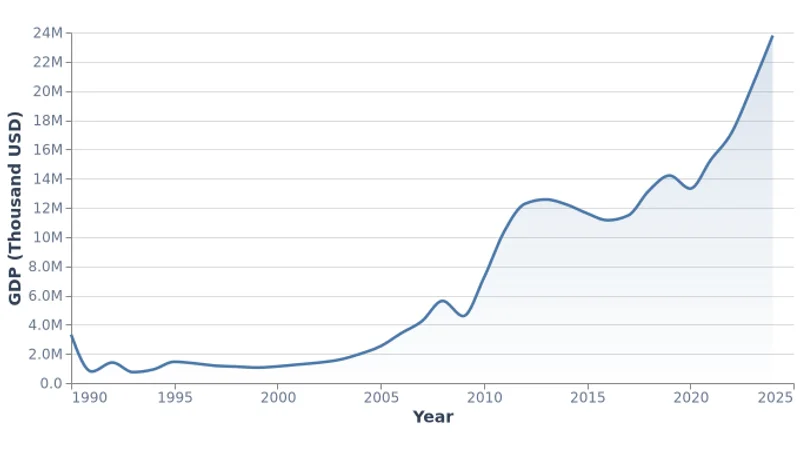
Annual GDP in US dollars for Mongolia from 1990 to 2024.
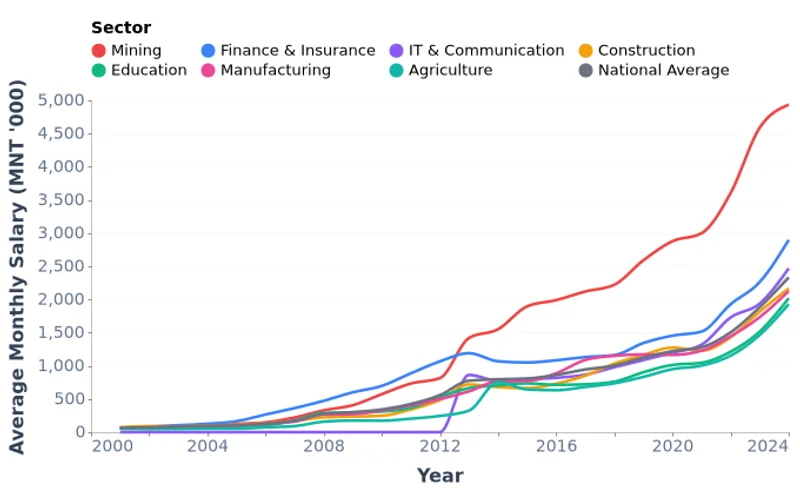
Average monthly nominal wages across major economic sectors in Mongolia from 2001 to 2024, showing how wages in mining, finance, IT, construction, education, manufacturing, and agriculture compare over time.
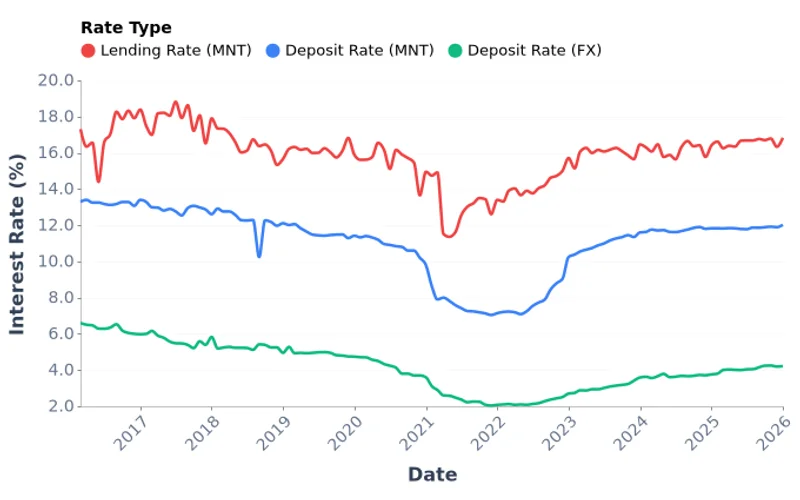
Monthly weighted average lending and deposit interest rates in Mongolia from March 2016 to January 2026. The lending-deposit spread has narrowed from ~4pp to ~4.8pp as rates stabilized.
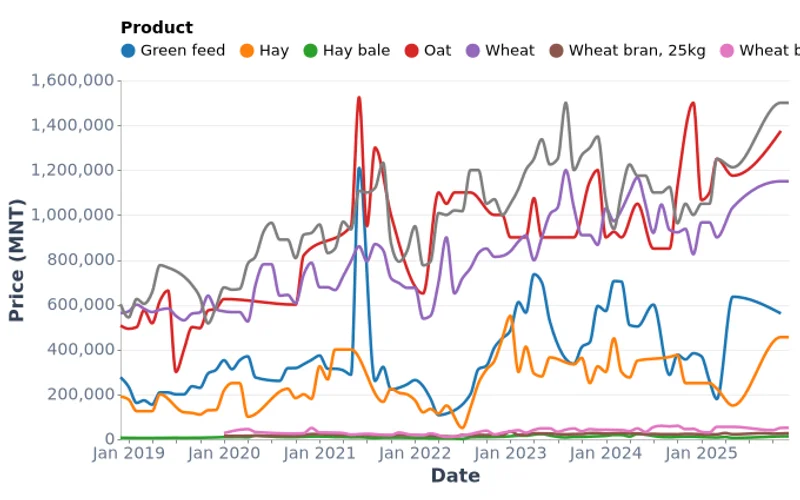
Monthly average market prices for crop products including wheat, hay, oat, and wheat bran in Tuv province, Mongolia's main agricultural region.
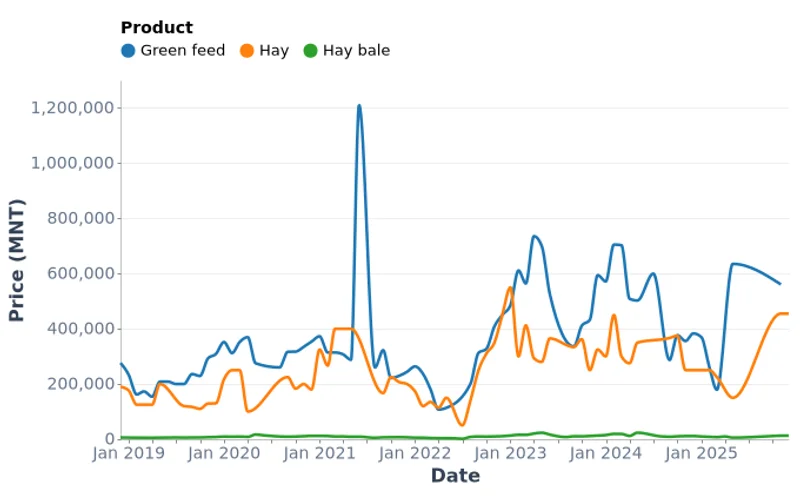
Monthly prices for hay bales, loose hay, and green feed across all aimags of Mongolia. Critical data for livestock herders.
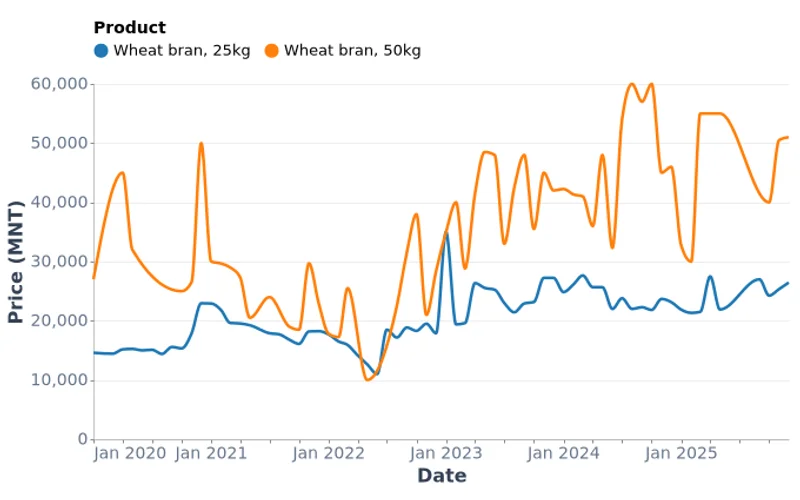
Monthly wheat bran prices (25kg and 50kg bags) across all aimags of Mongolia. Essential animal feed cost data for livestock farmers.
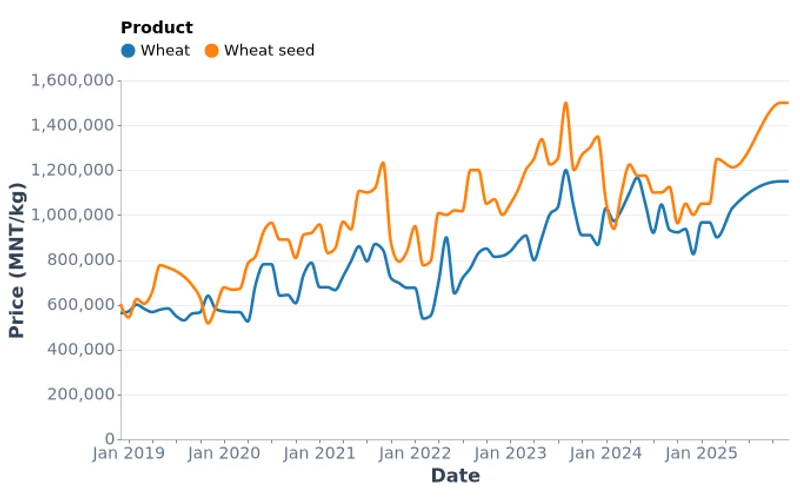
Monthly wheat prices across all aimags of Mongolia, including commodity wheat and seed wheat. Compare regional price differences.
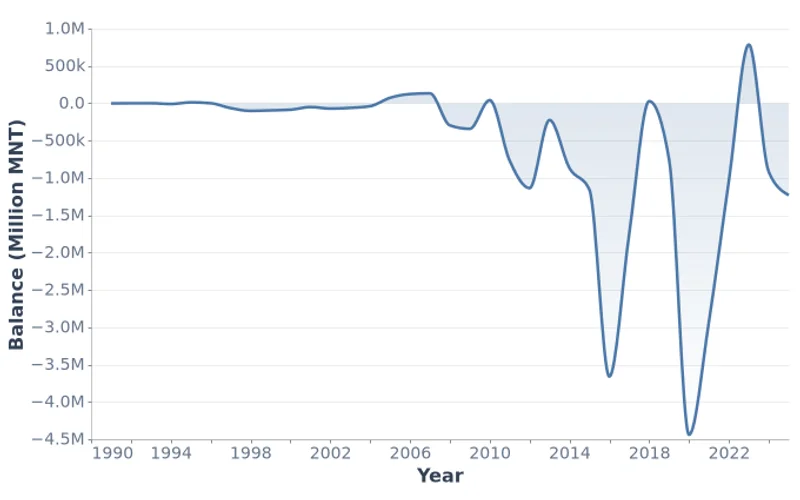
Mongolia's government budget balance from 1991 to 2025. The largest deficit was -4.4 trillion MNT in 2020 (COVID-19), while 2023 recorded a surplus of 785.9 billion MNT.
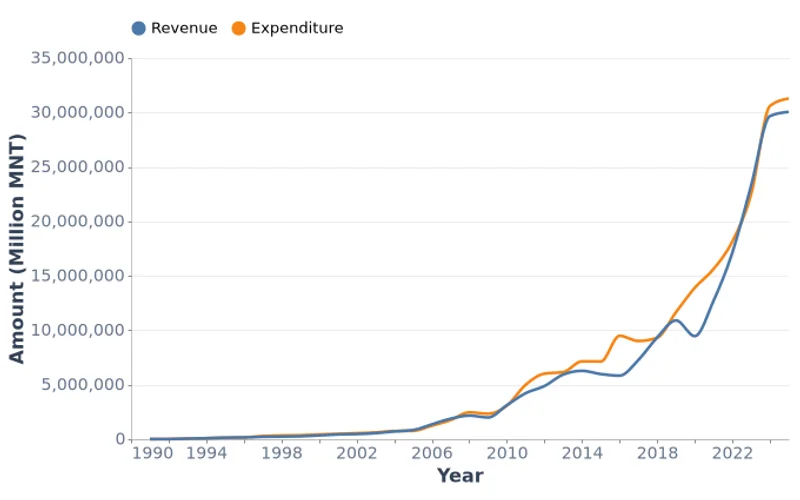
Mongolia's government revenue and expenditure from 1991 to 2025. Revenue grew from 7.2 billion MNT in 1991 to over 30 trillion MNT by 2025.
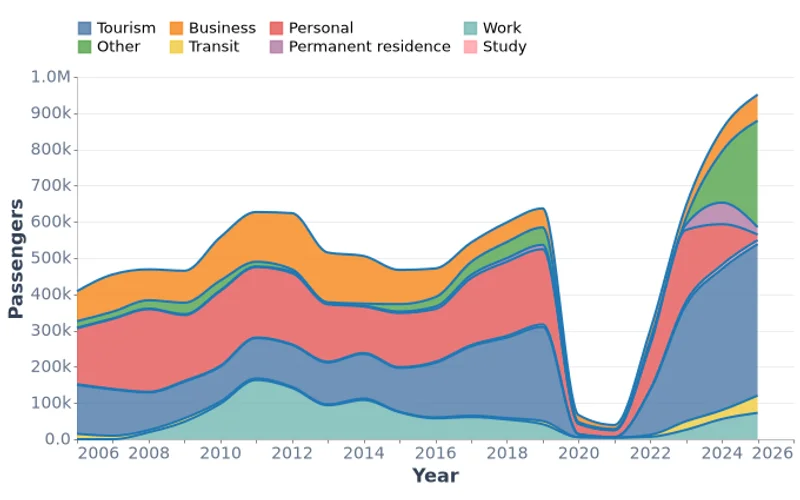
Annual inbound passengers to Mongolia by purpose of visit from 2006 to 2025. Tourism dominates at 44% of arrivals in 2025, with strong recovery post-pandemic.
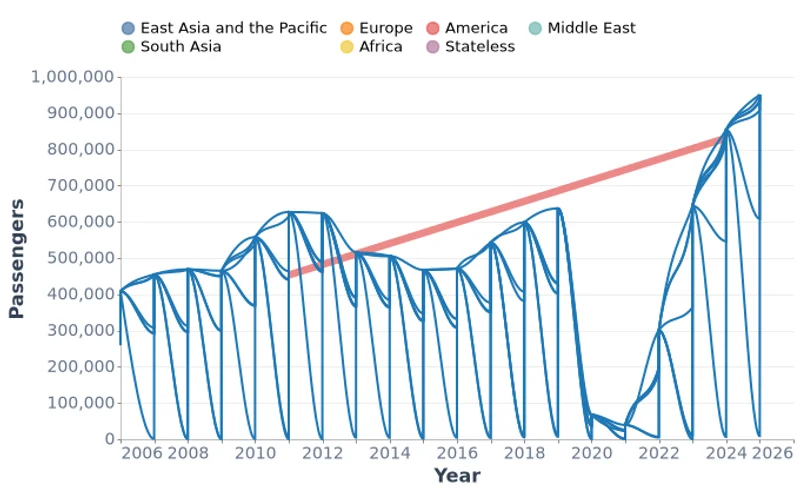
Annual inbound passengers to Mongolia by geographical region of origin from 2006 to 2025. East Asia and the Pacific dominates arrivals, accounting for over 60% of visitors.
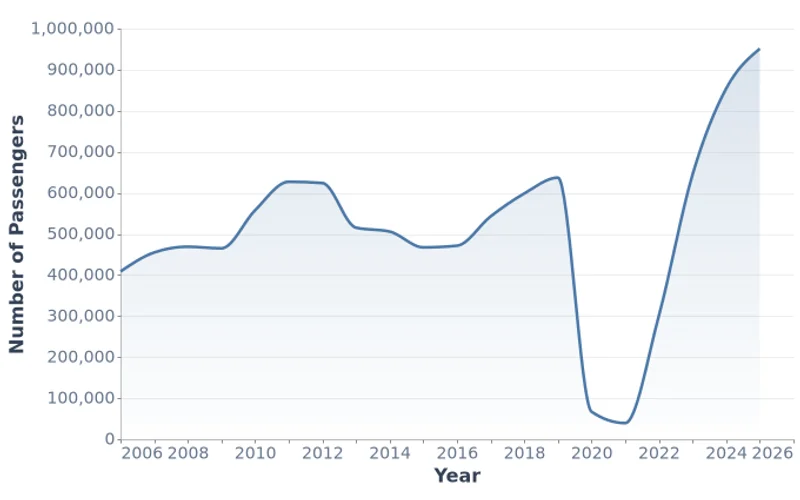
Total foreign passengers arriving in Mongolia from 2006 to 2025. Arrivals reached 951,208 in 2025, recovering from the COVID-19 low of 39,236 in 2021.
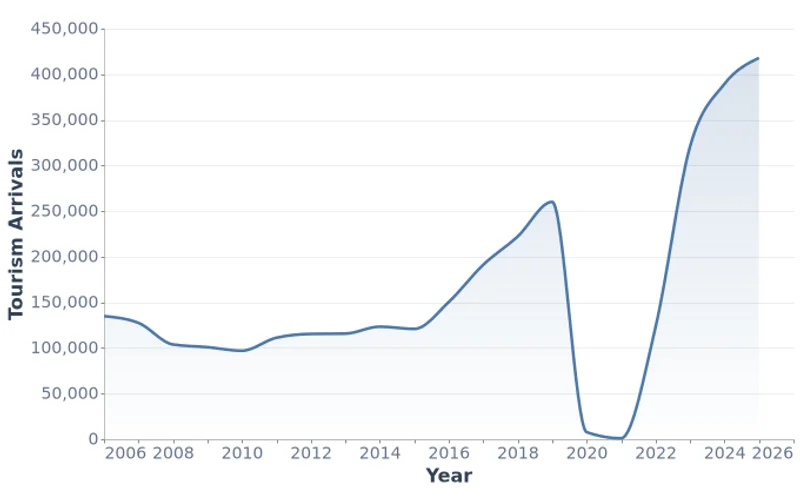
Annual tourism arrivals to Mongolia from 2006 to 2025. Tourism peaked at 417,935 visitors in 2025, recovering strongly from the pandemic low of 1,010 in 2021.
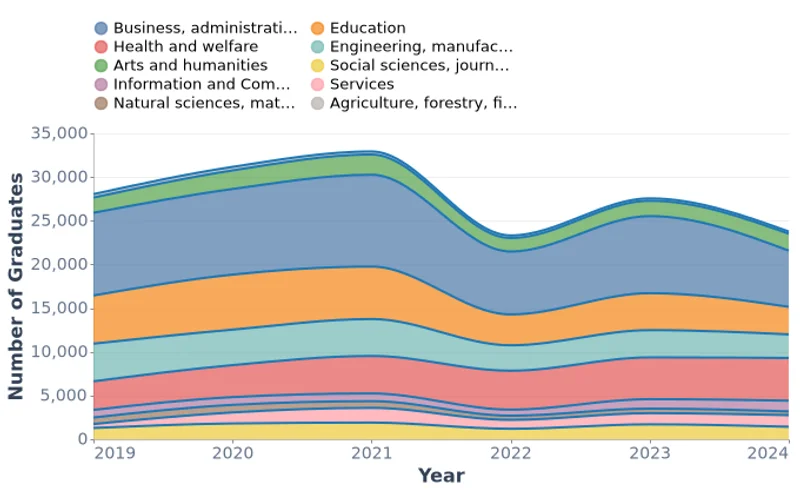
University and college graduates in Mongolia by professional field from 2019 to 2024. Business, administration and law consistently produces the most graduates, while Agriculture has the fewest.
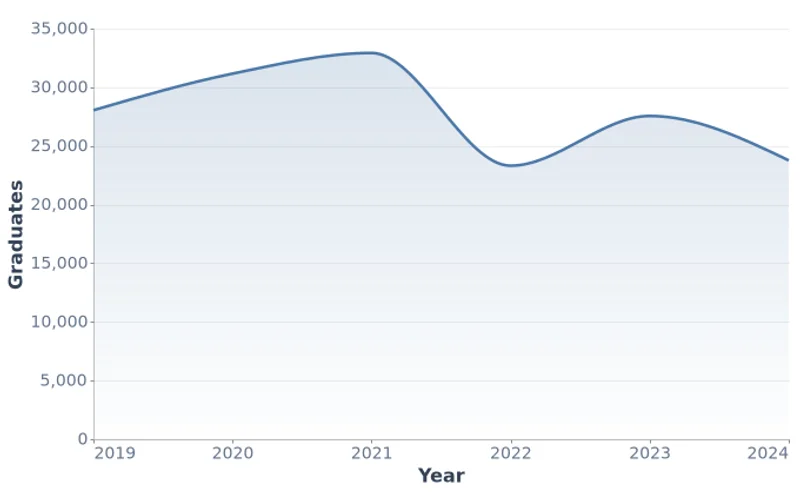
Total university and college graduates in Mongolia from 2019 to 2024. Peaked at 32,925 in 2021 before declining to 23,768 in 2024.
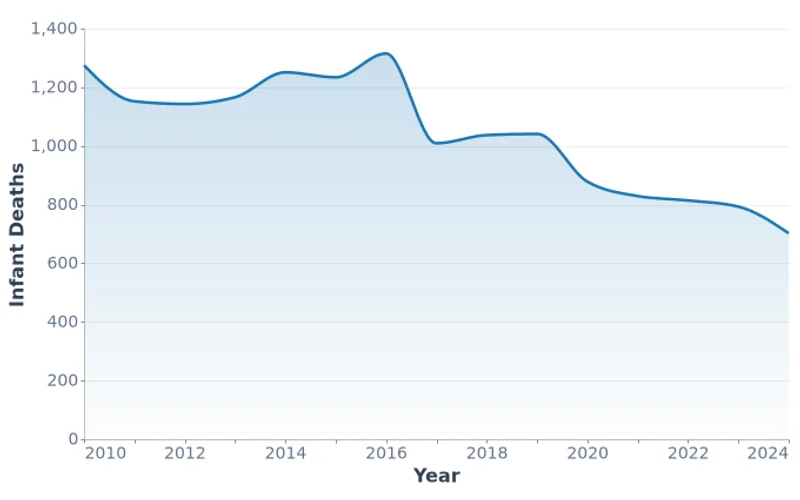
Number of infant deaths (under 1 year old) in Mongolia from 2010 to 2024. Infant mortality has decreased 45% from 1,275 deaths in 2010 to 702 in 2024.
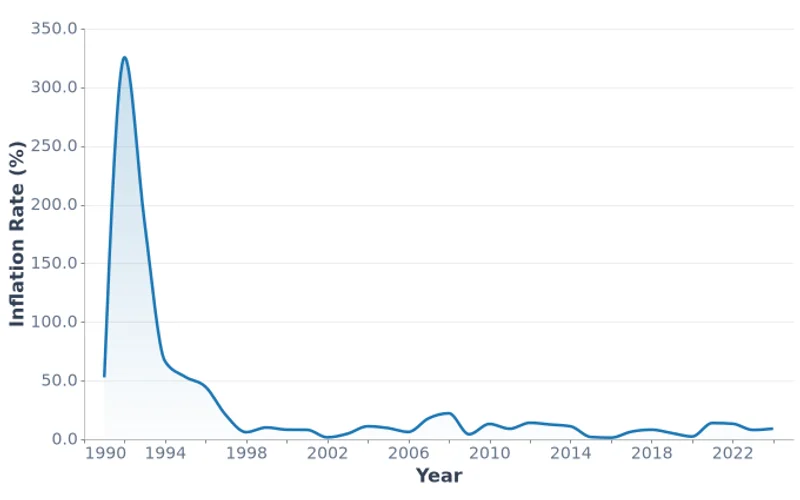
Annual inflation rate (year-over-year percentage change in consumer prices) for Mongolia from 1991 to 2024.